Free Chapter on Digital Analytics: Free Offsite Tools & Paid Offsite Tools
Continuing the earlier post about Digital Analytics, this post will cover some free offsite tools and some paid offsite tools.
1. Google Keyword Tool
It’s not ideal but Google keyword tool could provide some valuable insights. In essence, Google Keyword tool is a free tool offered by Google, which helps users know how much search volume a certain keyword has on average across desktop & mobile devices in a certain place. More details about how to use Google Keyword Tool could be found here. One could compare his/her brand with competitor brand in term of search volume to see how popular each brand is. Or one could investigate the demand for a certain product/service in certain geo-location. One of the key drawback of this tool is that the local monthly search volume is the monthly average taking into consideration the data from the last 12 months, so you can not see seasonal fluctuation or influence of advertising campaign with this stand alone number. To solve that, Google has another tool called Google Trends. It used to be called Google Insights for Search.
2. Google Trends
Again this is a free tool. You could use it as it is or login using your Google account to use it and see additional information.  It’s pretty straight forward to use.
- You could start by typing in just one topic of interest or multiple topics separated by comma.
- Each topic of interest would be represented by one line. Each line will have a different color.
- While looking at world wide data, from 2004 until now as a time frame may be useful sometimes, more often than not you need to change the location to specific country/city of interest to yield actionable insights.
- Both location/duration and other options could be found on the right hand side menu. The interface is pretty intuitive.
Let me explain a couple of definitions to make sure that we are on the same page:
- Interest over time: Numbers represent search volume relative to the highest point on the chart, which is always 100. In other words, this number is not absolute number and you should pay more attention to the trend or the difference between two points relatively.
- Search terms: To compare up to 5 searches, separate them with commas: "table tennis", squash, handball. This means no more than 5 lines at any time.
To find any of several terms, separate them with plus signs: tennis + squash. Put exact phrases in quotes: "table tennis" Put a minus sign before a word you don't want: wimbledon -tennis
- Regional interest: Numbers represent search volume relative to the highest point on the map which is always 100. Click on any region/point to see more details on the search volume there.
- Related terms > Top Searches: Top searches refers to search terms with the most significant level of interest. These terms are related to the term you've entered; if you didn't enter in a search term, the top searches will be related to the category or country/territory you've chosen.
- Related terms > Rising Searches: Rising searches highlight searches that have experienced significant growth in a given time period, with respect to the preceding time period. So if you're comparing data for a search term during 2006, the time period serving as the basis of comparison is 2005. Similarly, if you're comparing searches for that term during May of 2006, the basis of comparison is April of 2006.
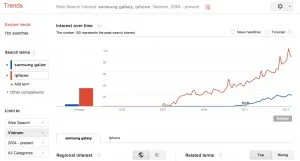
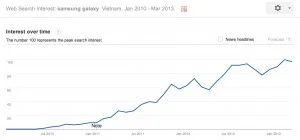
In Vietnam for example, iphone is enjoying a healthy lead vs Samsung galaxy for the past 12 months. Even if you don’t see the line for “Samsung Galaxy” went up much during Samsung Galaxy product launch event, it’s mainly because in relation to “iphone”, the uplift was small. So if you really want to see, you can exclude “iphone” and just look at “samsung galaxy” alone. 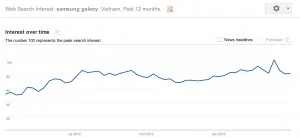
- Another point worth mentioning is that for a new product launch, new campaign Google Trends may not have the latest data so you need to wait for a while (like a month). If after a couple of months, you haven’t seen much of an improvement, that means your product launch/campaign didn’t generate enough buzz and people were not searching for more information about the product/topic of interest.
- For brand manager, looking at this graph over the course of 1-4 years could show interesting trends as well.
3. comScore:
comScore has a range of products/services:
- Audience Analytics
- Advertising Analytics
- Digital Business Analytics
- Mobile Operator Analytics
It works based on Panel-based methodology which simply means comScore would recruit user to join its panel. User would need to answer questionnaire so that comScore understand who would be using a particular computer at home or at work. After installing a special software on the computer, the software would monitor every online activity from that computer. By knowing who would be using that computer from the questionnaire, looking at user’s behavior and other reliable independent reports about internet users in a location, comScore would be able to project upwards to the full online population in a certain location. comScore products could be used for various purposes, especially media planning in Vietnam and campaign evaluation. You could read more about each product from comScore site. Just to give one example, if you are looking to target male, age 25-30 in Vietnam, who like cars, comScore would be able to give you a list of sites in Vietnam that your target audience frequently visits and the likelihood of you finding them there. After running a campaign, using Campaign Reach/Frequency report, you should be able to know how much of your target audience you actually reach. Besides the paid products, comScore often publishes reports/whitepapers on various different topics related to Digital activities. Look under Insights on the website and you could filter by country, tag, author, by keyword since there are many reports. One of the latest report comScore published that has Vietnam in it was “Introduction of Online Video Measurement Service in Taiwan, Vietnam, Indonesia and the Philippines”. Excerpt from the report “Across the Asia-Pacific region, video viewing penetration ranged from 66.9 percent in Indonesia to a high of 89.8 percent in Vietnam, as both broadband access and content availability factored into online video viewing adoption. Vietnam (89.8 percent reach), Hong Kong (88.7 percent reach), Singapore (84.5 percent reach), Japan (83.7 percent reach) and New Zealand (83.4 percent reach) all saw online video penetration exceed the global average.” You Tube is the number one video viewing, sharing site in Vietnam with nearly 10 million unique viewers. 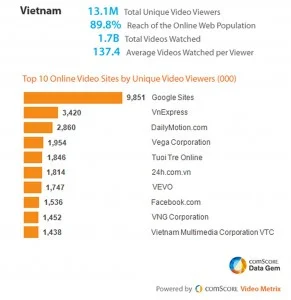 Detailed traffic information about a particular site could be found using comScore as well:
- site unique visitors
- average time on site
- average page viewed
- demographics of visitors
- whether my site’s audience also visits my competitor’s site? if yes how many percent is the overlapping?
- The beauty of these data is that you can compare almost any insights with your competitors/your category so that you can have better overall picture.
If you want to have more information about their products, feel free to contact comScore directly.
4. Hitwise
Hitwise works differently compared to comScore. Before Hitwise was bought by Experian, Hitwise used data from ISP (your local internet service provider). All of the traffic you are using have to go through your ISP or at least that’s what happen for normal users so by partnering/being able to use data from ISP, you should be able to get plenty of information about traffic to each site, how much of that traffic comes from search etc... Hitwise could aggregate and segment data to provide:
- Competitive Intelligence
- Search Intelligence with some noteworthy data like: Search terms to a website or industry, Search engine results page (SERP) rank reports etc...
- Consumer Segment and AudienceView: report like Online Behavior of your target audience could be obtain, what they do, which site they visit etc...
- Conversion Intelligence for example: Benchmarking website conversion rates against key competitors and identify top acquisition strategies
- Ad effectiveness for example Profiling beyond demographics by matching your visitor profiles to advertisers’ target audiences to discover new opportunities
One significant drawback for Hitwise is that i am not sure if they have data in Vietnam. It’s likely that they don’t have data for this market. However the parent company Experian does have an dedicated site for Vietnam at http://www.experian.com.vn/index.html I often use the free dashboard data from Hitwise in certain country like the one for Singapore or Hong Kong. If has some useful information like Search Engine market share by volume of searches. 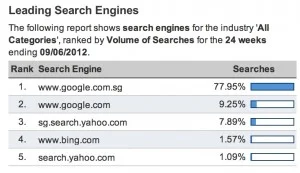 Or top website
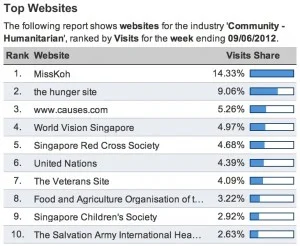
 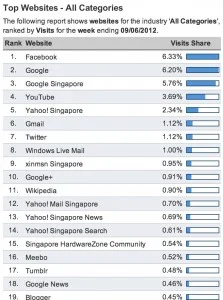 Every month, there is an Industry spotlight which Hitwise will gives detailed data on that industry from top websites, top search terms in that industry, top upstream traffic etc... This month it is Community - Humanitarian
5. Listening tools
While these tools are part of the Paid offsite tools, i want to dedicate a new portion to them because they are becoming more and more important with the use of social media. Why do we need listening tools in the first place? It’s because there are so many conversations, so many like, share, comments, tweets, happening in an interconnected world. Also with more and more blogging platforms entering the marketplace like blogger, wordpress, tumblr etc..., more and more people are empowered to produce/publish their own point of view. (The author of this blog is included :D ). Every day there are so many new content being written, copied, commented on news sites, forums, classified sites etc... In this noisy world, there are tools that help brands to understand what is being said about them, who are saying what, on which channels/platforms etc... As consumer is spending more and more time with different social media platforms, brands start to appreciate the value of social media and we start to see an increasingly sophisticated approach to social media exhibited by brands and agencies even in Vietnam. Many companies are looking at Facebook Insights, You Tube Channels insights and other tools trying to optimize their social campaigns. Crisis management has always been important for brands and with social media, the speed of information spreading is even getting faster. Brands need a tool that can help them/alert them for any negative PR, negative news being discussed/commented/shared before things are out of control. Other benefits offered by listening tools/platforms include:
- Competitive Intelligence: how consumers are talking about your competitors’ products/services. Where they are sharing their opinions, what they value in a competitive products?
- Market reaction: understand reaction to your product launch, customer’s feedback, concern.
- Great customer support: Satisfaction or dissatisfaction is the most common type of sentiment your customers will express about your brand online. Social media listening tools will not only allow you to find those comments quickly, but to respond timely, helping to stop bad press from spreading farther.
- Product development support
- Sentiment Analysis: understand how consumers feel about your product/service, what they like/dislike.
Some of the more popular tools in the US and Europe include: Alterian , ASOMO, AT Internet, Attentio, BrandsEye, Brandwatch, Cymfony, Infegy (Social Radar), Market Sentinel, Meltwater Group, Onalytica, Radian6, Sentiment Metrics, Sysomos, Visible Technologies. In this region, technologies like Brandtology, JamiQ, SocialBakers seem to be quite popular as well. Let’s go through some of the more popular tools out there: Radian6 (Salesforce Marketing Cloud) This is a well rounded tool/service with lots of functions. They can listen to multiple channels and automate a lot of the listening, analyzing phase, giving you more actionable insights. Then you could use the engagement console to engage, response if you will to those conversations/comments or just flag it for further analysis.  They could listen to conversation happening on Facebook, Twitter, You Tube, Google Plus, Pinterest, Linkedin, blogs, forums and other social platforms of course. But i am not too sure if they track normal news site etc... The company was bought by SalesForce not too long ago for $326 million. With Radian6 and SalesForce combined, one could expect social CRM offering from SalesForce to be up at a much higher level. Then there is Marketing Cloud, which (from SalesForce marketing materials), the first unified Social Marketing suite. It can “Listen at social scale. Create compelling social presences. Connect with customers. Align sales, service and marketing. Amplify your content. Track campaign ROI. Drive real business results.” (from SalesForce’s Press Release). They sell different services/packages like:
- Analysis Dashboard
- Insights
- Engagement Console
- Professional service
- etc...
It is an Enterprise tool so do not expect it to come at a cheap monthly pricing. If i am not mistaken, the minimum should be in the range of $600+/month. SocialBakers This tool is known and used somewhat in Vietnam by clients and agencies. It may be because the entry price is very low and a free 14 days trial. It has both Analytics module (called Analytics Pro) and Engagement module (called Builder Pro) as well. Below is the pricing plan for Analytics Pro. 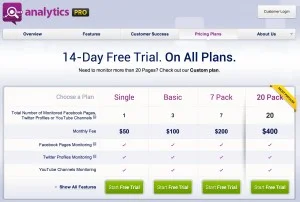 With Analytics Pro, you could know more detailed information about any fanpage that you are interested in or twitter profile or You Tube channel. It is useful when you want to check out competitor’s fanpage or when you are preparing for a client pitch and you want to understand how the existing client’s fanpage is doing. MarketInsights is more for planning phase since you want to understand about target audience in certain market. However if you try Facebook tool for advertiser, you could find some useful information too. That's all from me for today. Feel free to drop any comments/thoughts Thanks, Chandler
