8 key facts about Japan Digital Marketing Landscape
Japan's $11B digital ad market reveals surprising insights: feature phones still dominate mobile internet access, and the country lags behind US and China in digital adoption.
Hi there, This is part of the series about key facts about digital marketing landscape and mobile e-commerce landscape in different countries. You could download the presentation file on Google Drive here or try slideshare. Please help to quote the source when you use the graphs.
1. JP has over 100M internet users, 70M+ mobile phone internet users and over 50M smartphone users in 2015
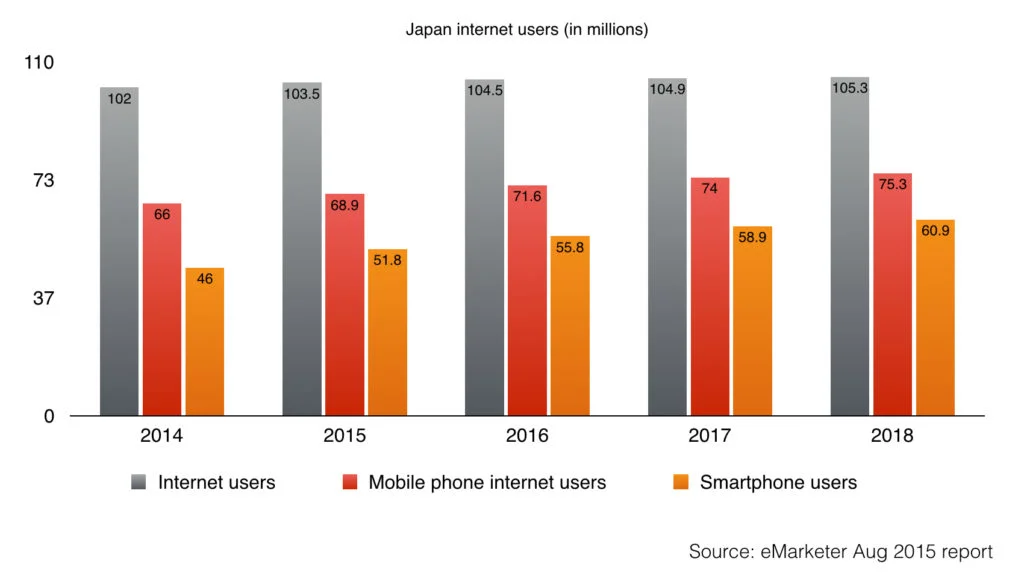 Out of the total population of about 125 millions people, the internet penetration rate is around 82%. As you could see from the graph above, Japan has more mobile phone internet users than the number of smartphone users. This is because in Japan, we still have a significant number of feature phone users and they could access the internet using their feature phone as well.
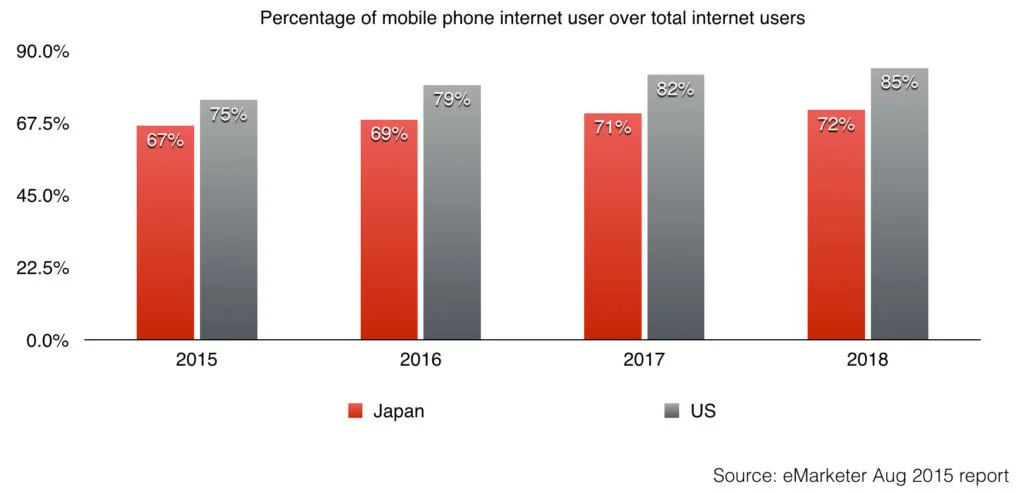
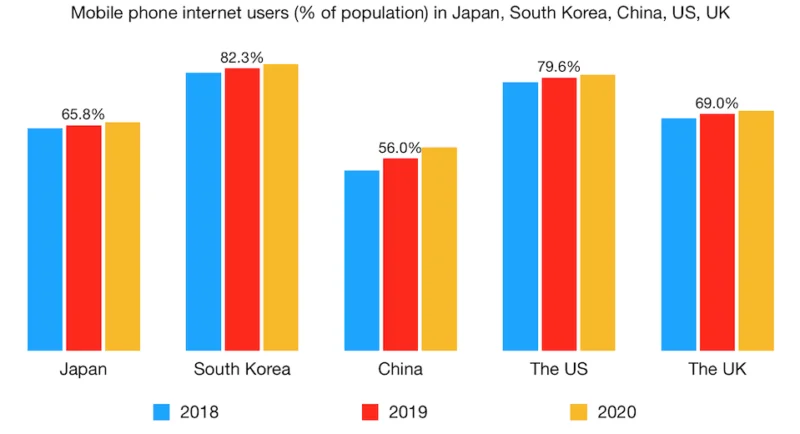
2. JP is lagging behind the US when it comes to percentage of mobile phone internet users over total internet users
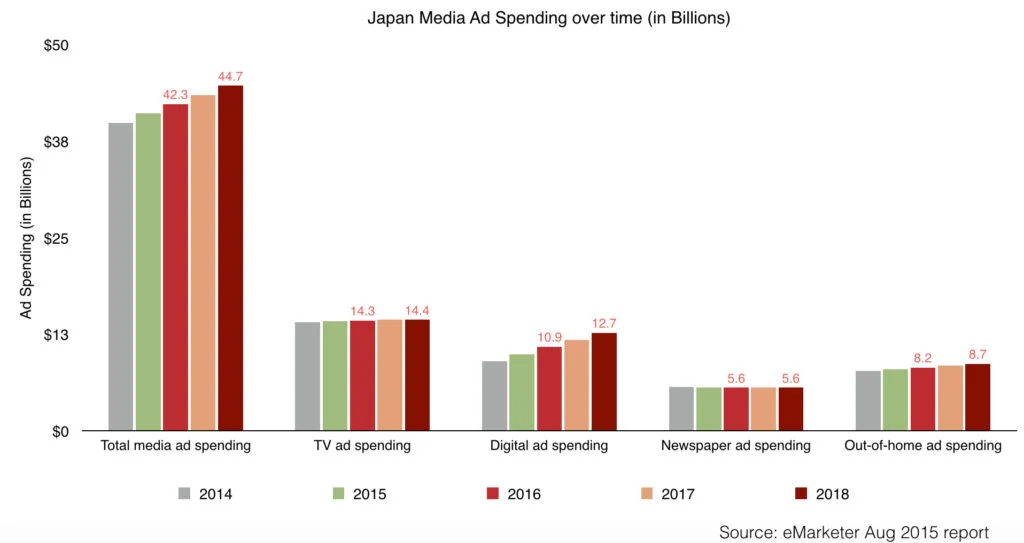
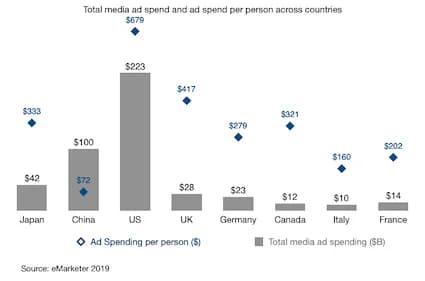
3. Digital Ad Spending in JP is estimated at $11B in 2016 or 25.7% of the total media ad spending (lower than those of the US at $67B and 34.4%, or China at $40B and 49.1%)
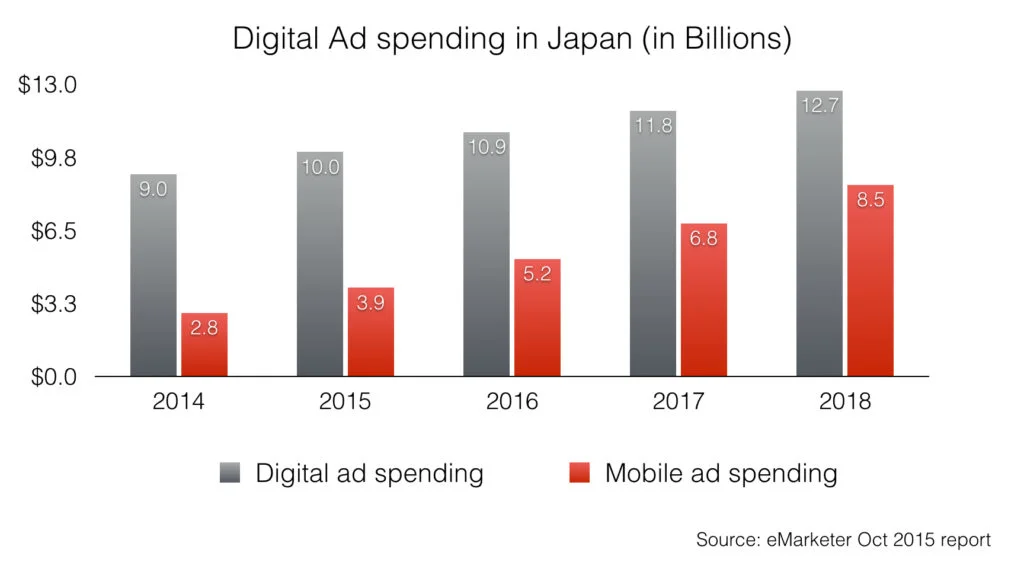
4. About 50% of digital ad spending in Japan is on mobile devices in 2016, similar to China and the US
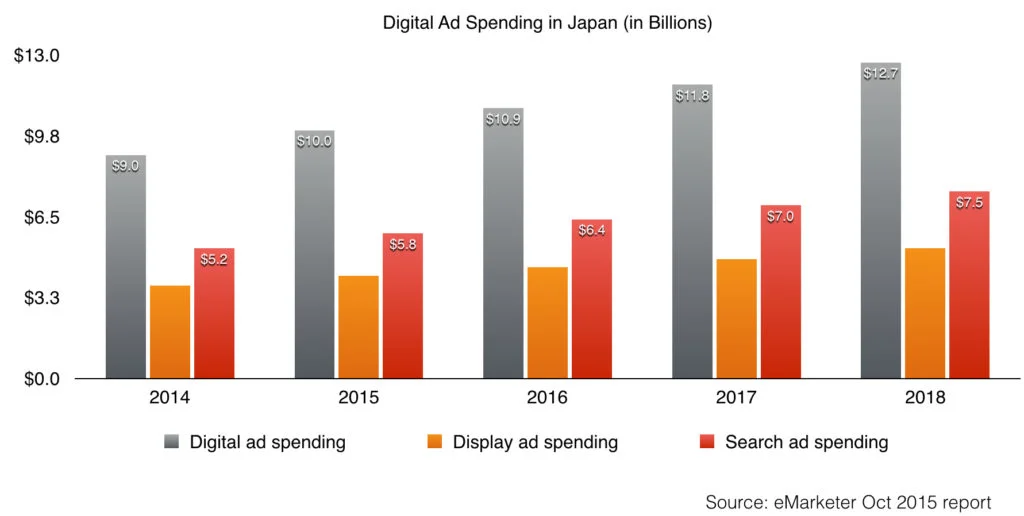
5. SEM ad commands about 59% of the total digital ad spending in Japan, similar to China and the US
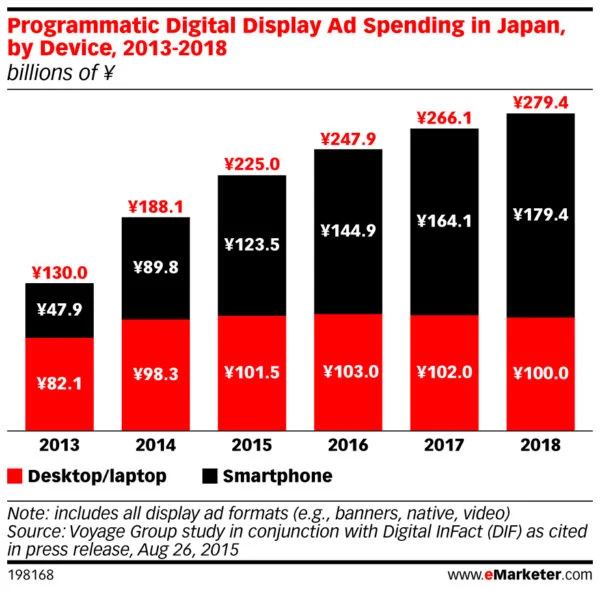
6. By the end of 2015, Mobile would lead Desktop when it comes to programmatic display in Japan (with 55% of the total programmatic spend)
7. Japan has the second-highest digital buyer penetration (as % of total internet users) in the world behind the UK
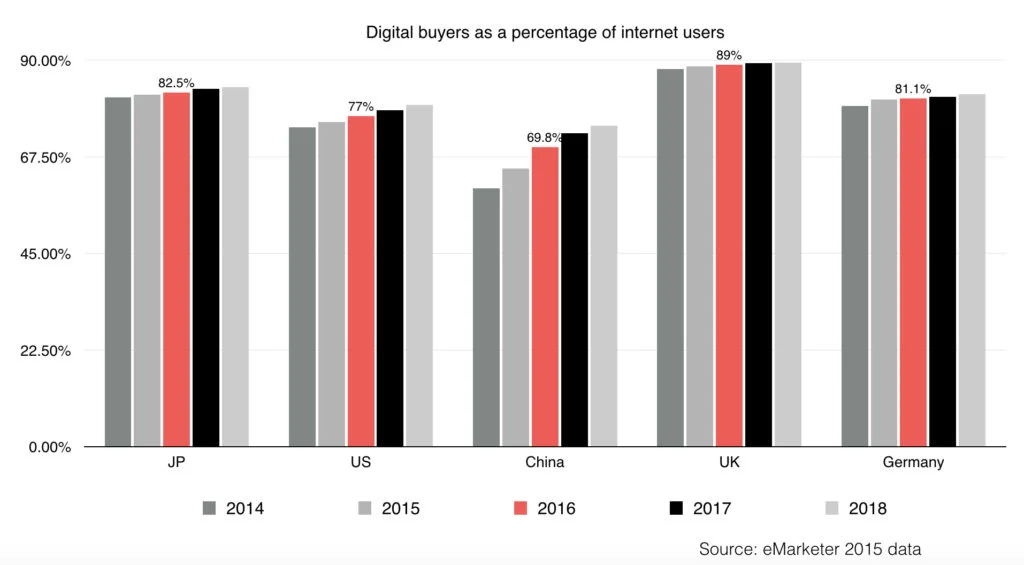 Digital buyer: ages 14+; internet users who have made at least one purchase via any digital channel during the calendar year, including desktop/laptop, mobile and tablet purchases.
8. Japan is the number fourth market in the world in terms of retail e-commerce sales
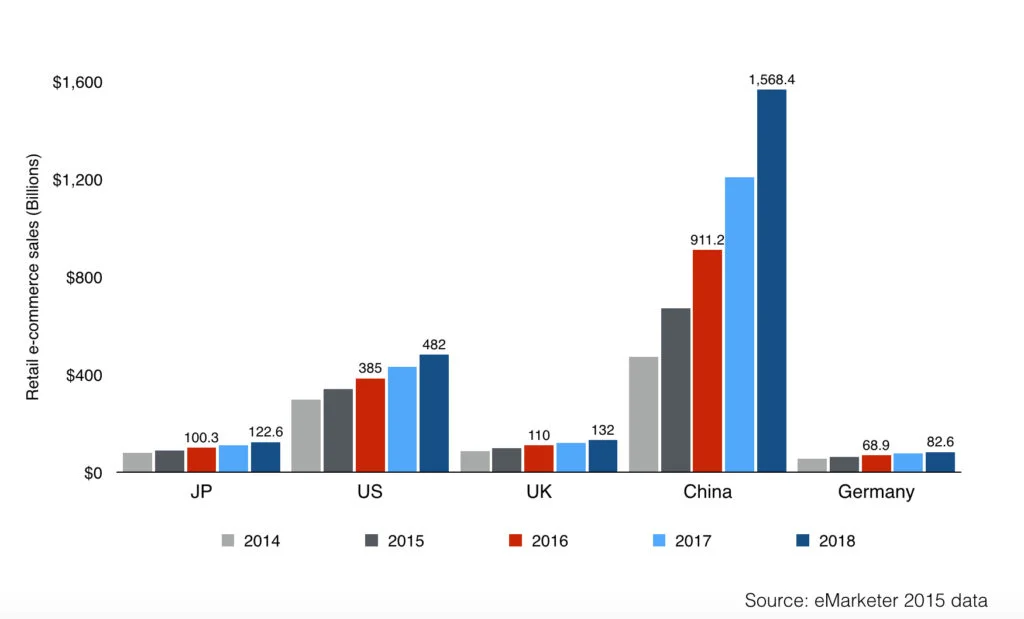 Retail e-commerce sales (as per eMarketer definition) includes products or services ordered using the internet via any device, regardless of the method of payment or fulfilment; excludes travel and event tickets; converted at the exchange rate of US$1=JPY105.855. You could download the presentation file on Google Drive here or try slideshare. Please help to quote the source when you use the graphs. Thanks, Chandler
