8 key facts about Japan Mobile Game Industry (update Mar 2019)
Despite Japan's aging population, it remains the world's #2 mobile game market with the highest paying users globally—here's the data you need to know.
This post was written in 2019. Some details may have changed since then.
Hi there,
Similar to other recent posts, many people continue to find my blog through the post about Japan mobile game industry back in 2017 so here is a refresh with the latest data. Hope you find it useful.
This post is part of the series about Japan that I have been writing in 2019. You can find other posts here:
Key facts about Japan Digital Landscape (updated Jan 2019)
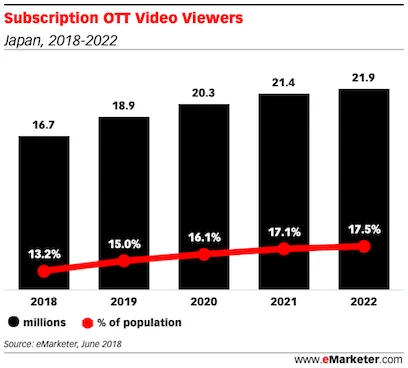
8 key facts about Japan Subscription Video on Demand (SVOD) landscape
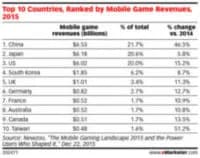
1. Japan has been (and expected to continue to be) number 2 mobile game market in the world
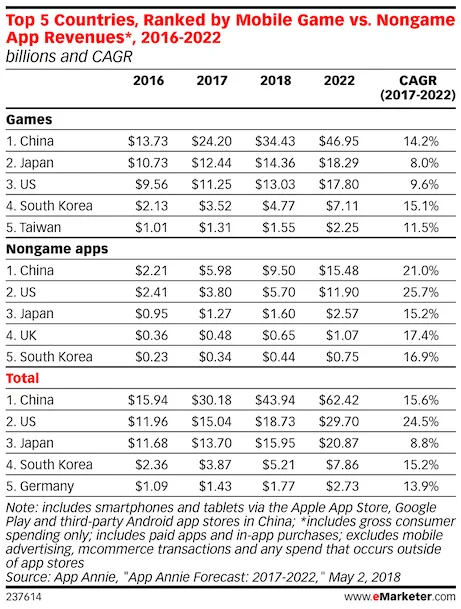
This is particularly impressive, given the aging population in Japan in comparison to the scale of China and a much more balanced (age wise) population in the US.
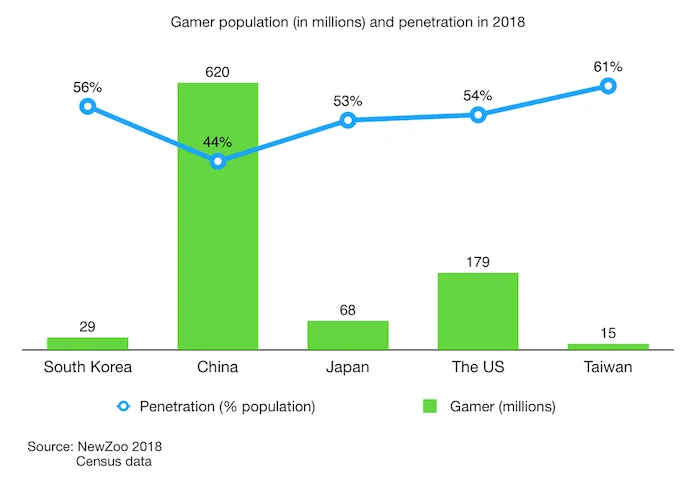
2. More than 1/3 of women and 41% of men play mobile games in Japan amongst the online population
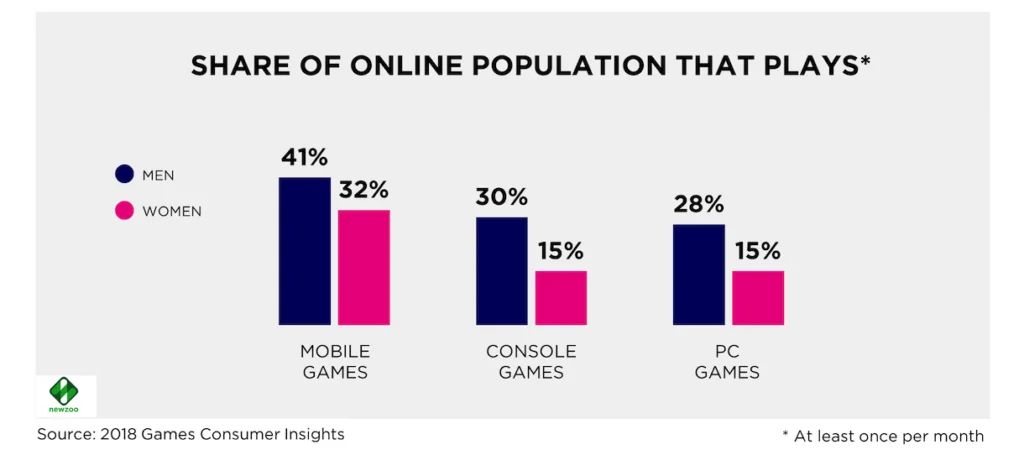
To put in more context, we are talking about more than 36M mobile gamers in Japan here.
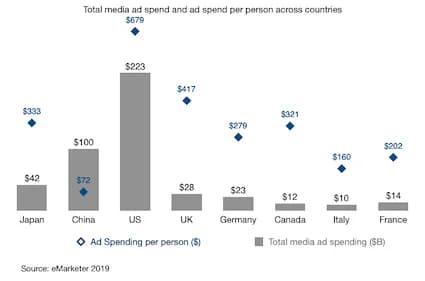
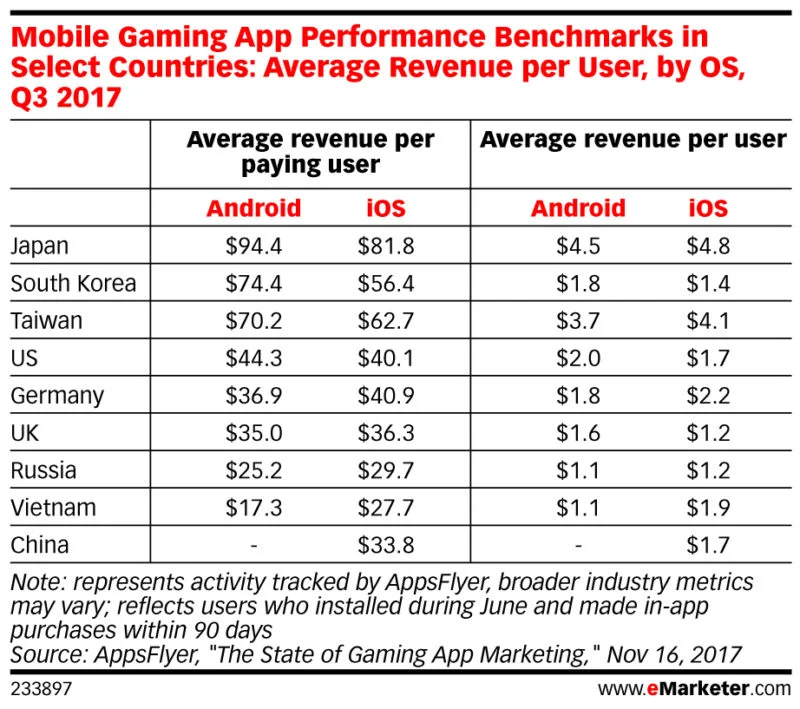
3. Japan mobile gamers top chart when it comes to average spend per paying user or average spend per user overall
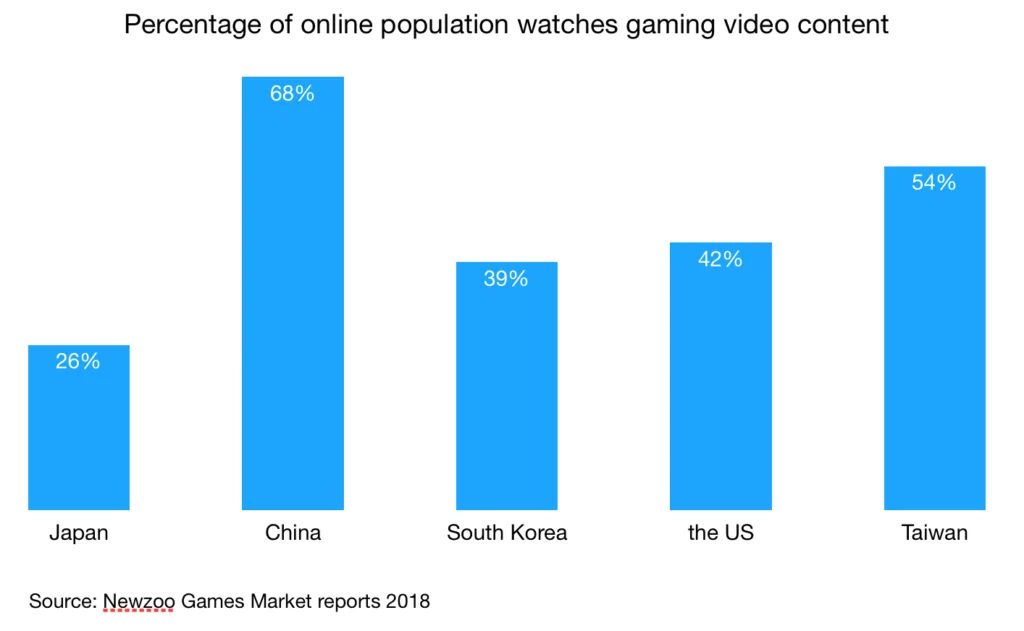
4. More than 26M Japanese watch gaming video content online, though the percentage is lowest amongst the top 5 mobile gaming markets
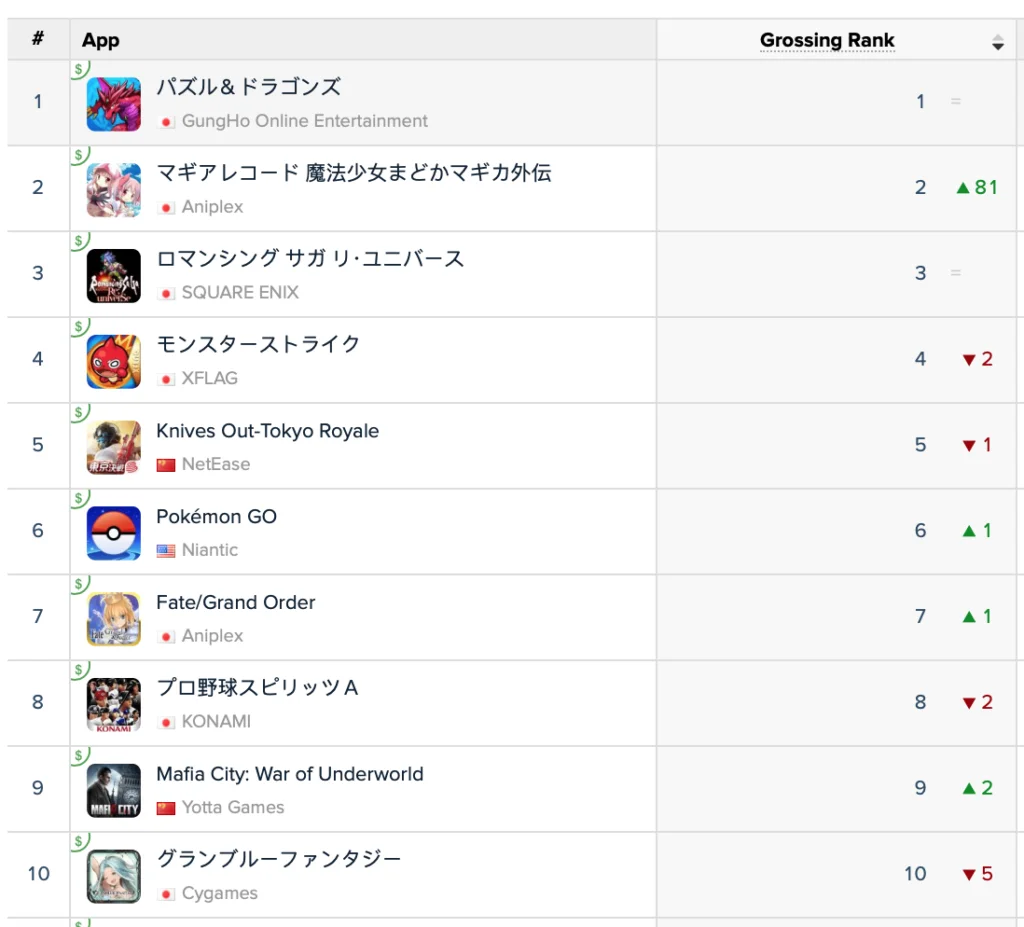
5. Majority of the top grossing games in Japan (across iOS and Android) are made by local publishers
90% of Google Play top 10 grossing games are made by local companies
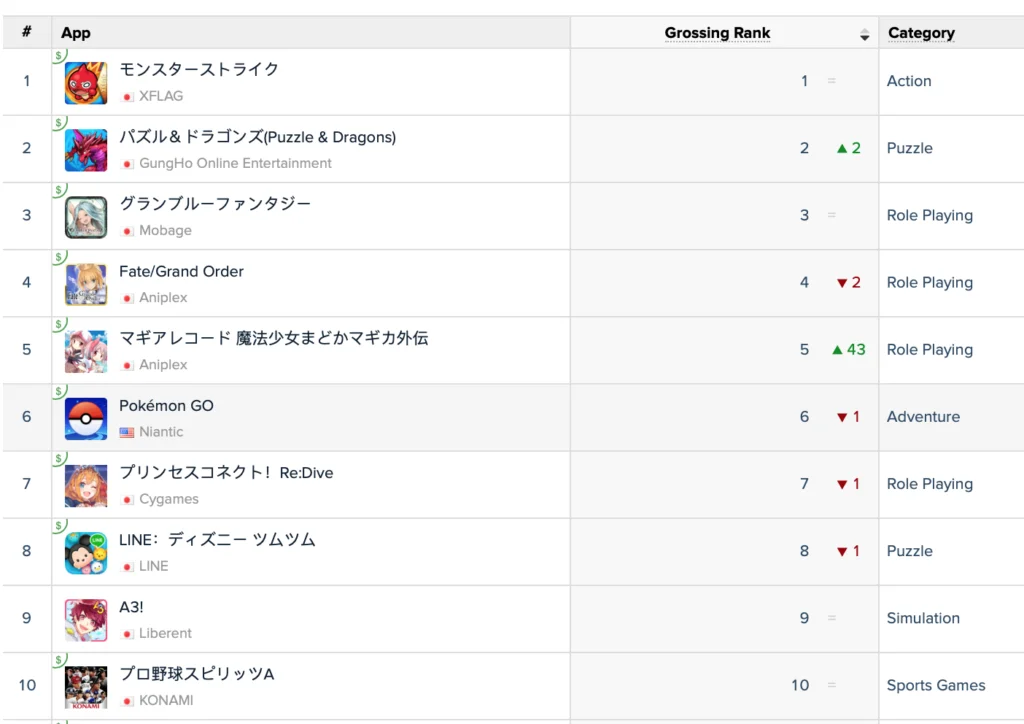
70% of top grossing games on iOS are made by local companies
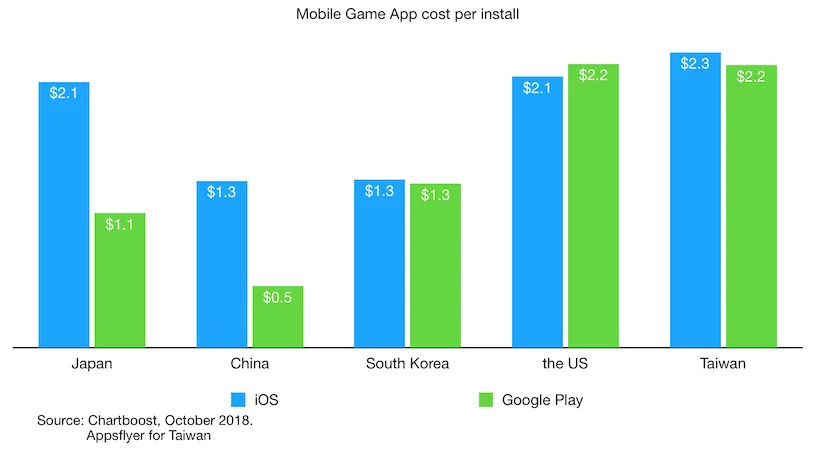
6. While cost per install for mobile game in Japan is more expensive than China or South Korea, it is comparable to the US or Taiwan across both iOS and Google Play
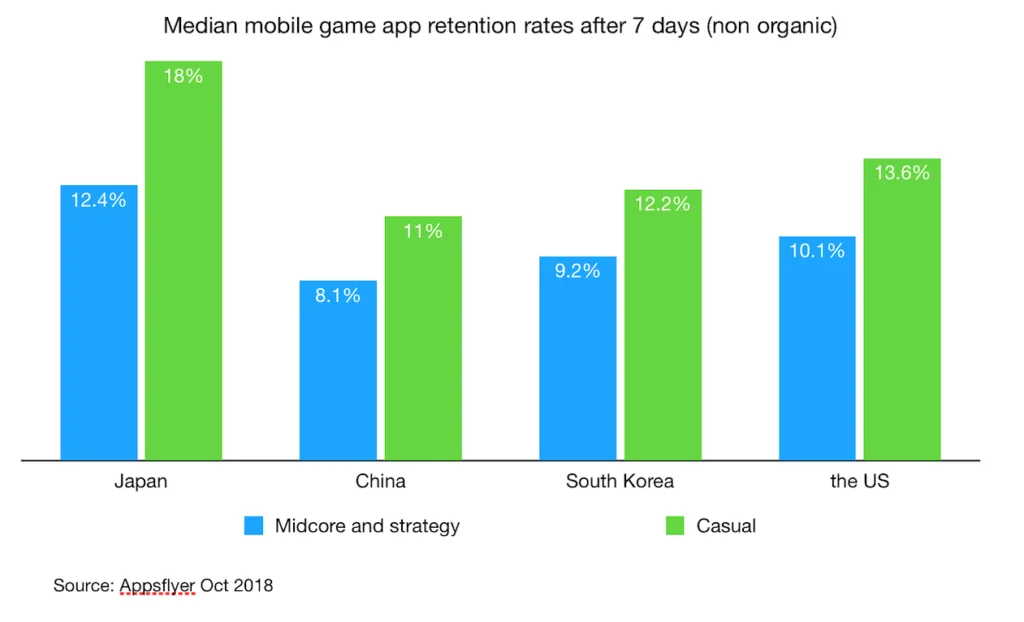
7. Overall for acquired users, retention rate in Japan after 7 days is better than China, South Korea and the US
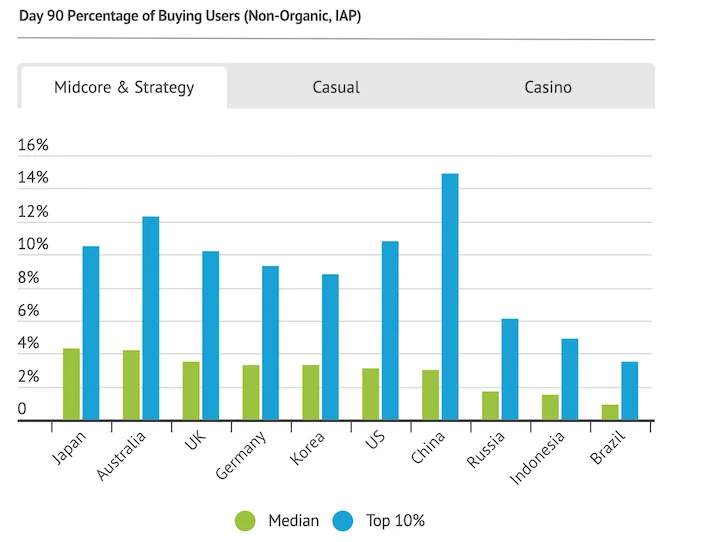
8. While Japan leads the world when it comes to percentage of paying users after 90 days, the percentage is still very small for non-organic user acquisition (AppsFlyer data 2018)
A similar observation for casual games
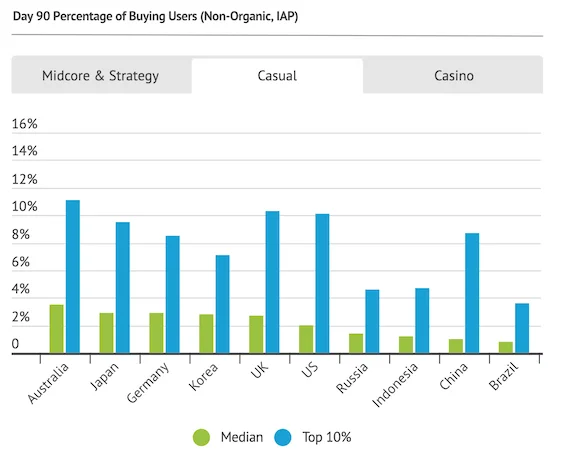
As you can see from the above, the top 10% games are doing 2 - 4 times better than the median so there are success stories, just that it is very competitive.
That's it from me.
Cheers,
Chandler