2015 年全球哪些国家已进入 Mobile First?
这篇从“用户时长结构”和“移动广告占数字广告比重”双维度对比 8 个核心市场, 结论是:美国和韩国已是 Mobile First,中国紧随其后,澳德加仍有明显预算迁移空间。
本文写于2015年,部分内容可能已发生变化。
Hi there,
过去几年,Mobile First 一直是全球热点。
关于北美(NA)、欧洲(EMEA)和 APAC 移动广告增长速度的预测也很多。
因此我想把美国、英国、德国、中国、日本、澳大利亚、韩国、加拿大几个核心市场放在一起看:
谁在 2015 年真正算 Mobile First?
我用两个指标:
- 用户时长(mobile vs desktop)
- 移动广告占数字广告比重
先给背景:eMarketer 预测 2016 年全球移动广告将超过 US$100B,并占数字广告 50%+。
也就是说,从全球预算结构看,明年我们就正式进入 Mobile First 区间。
如果你没时间看各国细节,先看结论:
- US 与 KR 在 2015 年已是 mobile first
- 中国紧随其后(2015 年约 45%),预计 2016 年达到 50%
- 在全球移动广告绝对规模 Top 8 市场里,AU、DE、CA 的移动占比相对偏低

关于“mobile(smartphone+tablet)vs TV/laptop”的时长数据,主要来自 Millward Brown 工具 here。
下图是:
- 移动广告占数字广告比例 vs
- 移动设备时长占(mobile+laptop)总时长比例
可以看到在主要市场(US、CN、UK、JP、DE、AU、CA、KR),移动设备时长占比约在 60% 左右。

下面按国家展开。
1. 美国:2015 年已是 Mobile First
Flurry(Yahoo)与 TechCrunch 数据显示:
美国用户在 Mobile App 上的时长已经超过看 TV。
2015 年 Q2:TV 约 168 分钟/天,Mobile App 约 198 分钟/天。

Millward Brown 数据也基本一致:
smartphone 151 分钟 + tablet 43 分钟,TV 147 分钟,desktop/laptop 103 分钟。

预算侧,eMarketer 预计移动占美国数字广告 51.9%(2015)。
所以美国在“用户时长 + 预算结构”两端都已 mobile first。

2. 中国:2015 年移动广告占数字广告约 45%
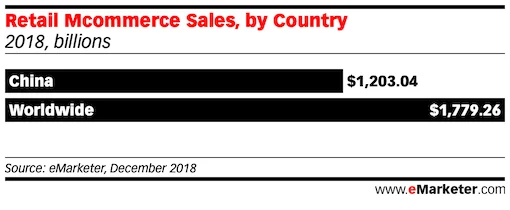
中国移动广告总量全球第二,仅次于美国并不意外。
2015 年 eMarketer 估算中国移动广告约 US $14B,约为 2014 年两倍。

预计 2016 年中国移动广告占数字广告会超过 50%。
同一报告还预测到 2017 年中国将进入 digital-first:媒体总投放中数字渠道占 53.6%。

时长侧,中国用户在数字媒体上的时间也已超过 TV:数字 50%+,TV 43.6%。
其中 smartphone(不含语音)约 33%,desktop/laptop 约 17%。

Millward Brown 给出的“mobile+tablet 229 分钟 vs TV 89 分钟”差距非常大。
我对这个值略有保留,毕竟中国市场广、分层复杂,TV 时长在不同人群里未必这么低。
3. 日本:2015 年移动广告约占数字广告 40%
2015 年日本数字广告约 US $9.7B,其中移动约 40%(US $3.85B)。
日本移动占比仍低于 US 与 CN。
但时长上,日本用户已明显“移动化”:
按 Millward Brown 数据,
mobile(smartphone+tablet)约 150 分钟/天,TV 约 125 分钟。

4. 英国:移动广告约占数字广告 40%
eMarketer 估算 2015 英国移动广告 约 £3.26B(US$4.97B),约占数字广告 £8.13B(US$12.4B)的 40%。
英国也将在 2015 年跨过关键节点:数字广告约占总广告 50%,TV 约 24.9%,Print 约 16.6%。

时长上,英国用户同样是 mobile > TV:
mobile 约 166 分钟 / 天,TV 148 分钟,desktop/laptop 97 分钟。
数据来自 Millward Brown。

5. 德国:2015 年移动广告约占数字广告 30%
德国与其他大市场一样,用户在 smartphone+tablet 上时长已高于 TV 与 laptop。
数据仍来自 Millward Brown:

预算侧,eMarketer 预计德国 2015 年移动广告约 $2.095B,约占数字广告 $6.67B 的 30%。
6. 韩国:2015 年移动广告占数字广告约 54.4%
eMarketer 估算韩国 2015 数字广告约 $2.94B,其中移动约 $1.6B。

时长结构也一致:
mobile 158 分钟 / 天,TV 127 分钟,desktop/laptop 94 分钟。

7. 澳大利亚:2015 年移动广告约占数字广告 28%
澳洲 2015 移动广告约 $1.36B,
约占数字广告(约 $4.6B)的 28%。
这个比例明显低于 US、CN、UK、KR。
但用户时长早已 mobile-first:
mobile 169 分钟 / 天,TV 125 分钟,desktop 102 分钟。

8. 加拿大:2015 年移动广告约占数字广告 33.7%
IAB Canada 估算 2015 数字广告约 $4.2B。
而 eMarketer 估算加拿大 2015 移动广告约 $1.416B。

我这边先到这里。
致敬, Chandler