जापान Mobile Game Industry के बारे में 8 प्रमुख तथ्य (मार्च 2019 अपडेट)
Japan की aging population के बावजूद, यह दुनिया का दूसरा सबसे बड़ा mobile game बाज़ार है जहाँ globally सबसे अधिक paying users हैं — यहाँ वो डेटा है जो आपको जानना चाहिए।
यह पोस्ट 2019 में लिखी गई थी। तब से कुछ जानकारी बदल सकती है।
नमस्ते,
अन्य हालिया पोस्ट की तरह, बहुत से लोग 2017 में Japan mobile game industry पर मेरी पोस्ट के ज़रिये blog पर आते रहते हैं — इसलिए यहाँ नवीनतम डेटा के साथ एक अपडेट है। उम्मीद है यह उपयोगी रहेगी।
यह पोस्ट 2019 में Japan के बारे में मेरी लेखन श्रृंखला का हिस्सा है। अन्य पोस्ट यहाँ देखें:
Key facts about Japan Digital Landscape (updated Jan 2019)
8 key facts about Japan Subscription Video on Demand (SVOD) landscape
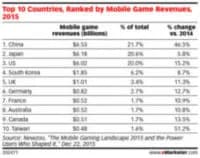
1. Japan दुनिया का दूसरा सबसे बड़ा mobile game बाज़ार रहा है (और आगे भी रहने की उम्मीद है)
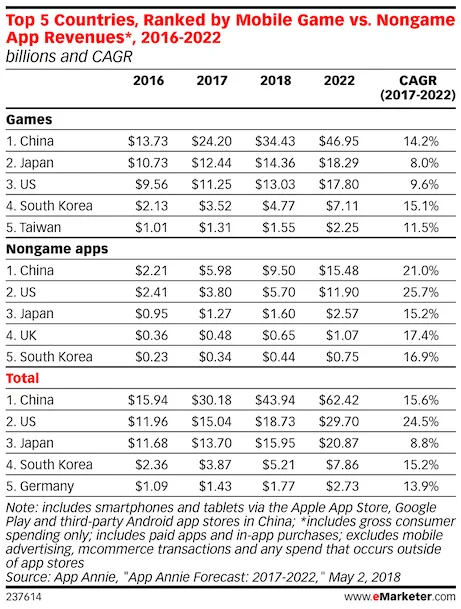
यह विशेष रूप से प्रभावशाली है, खासकर जब हम Japan की aging population को China की बड़ी scale और US की अधिक balanced (आयु के हिसाब से) जनसंख्या से तुलना करते हैं।
2. Japan की online population में 1/3 से अधिक महिलाएँ और 41% पुरुष mobile games खेलते हैं
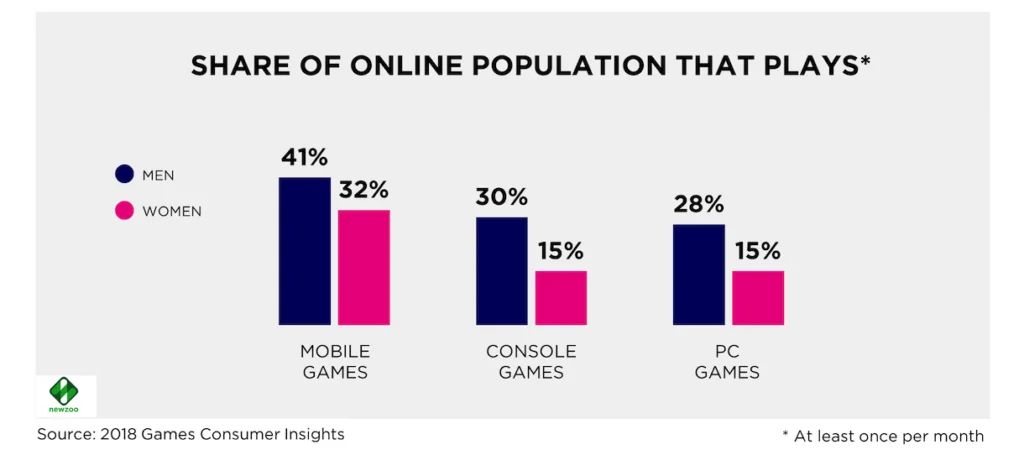
इसे और संदर्भ में रखें तो हम यहाँ Japan में 36M से अधिक mobile gamers की बात कर रहे हैं।
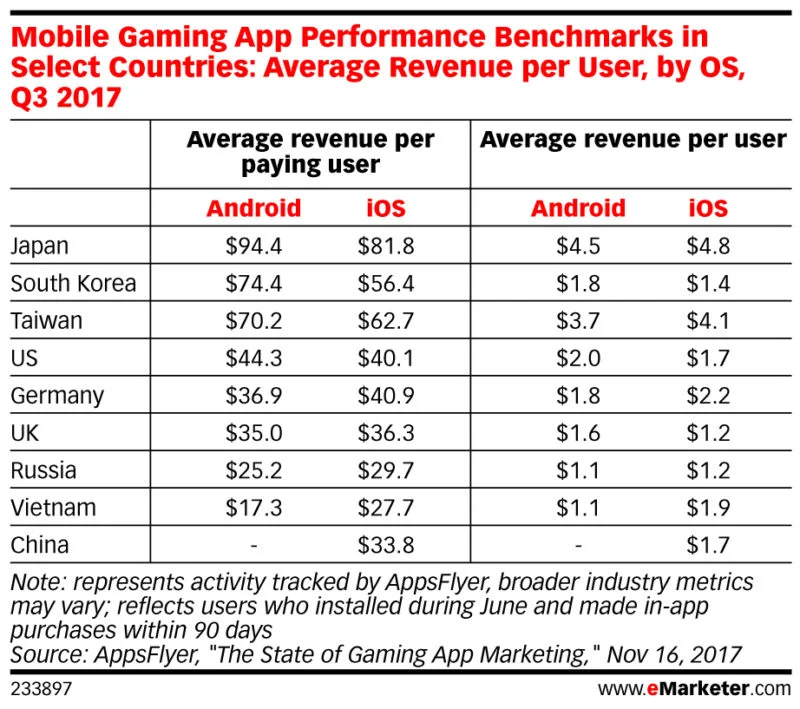
3. Japan के mobile gamers paying users की औसत spending और overall average spending per user — दोनों में शीर्ष पर हैं
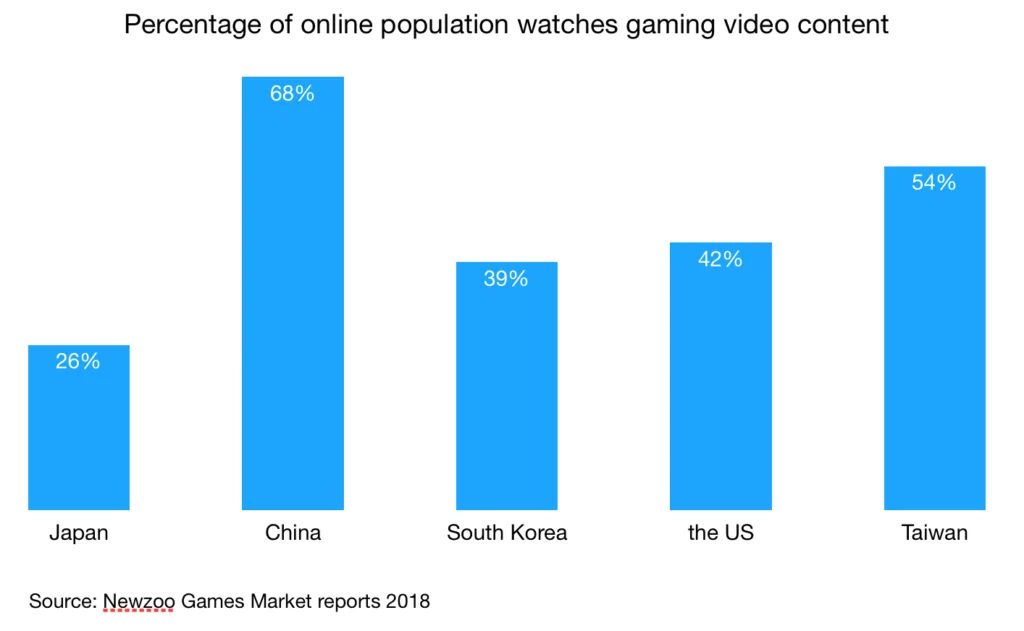
4. 26M से अधिक Japanese online gaming video content देखते हैं, हालाँकि यह प्रतिशत top 5 mobile gaming बाज़ारों में सबसे कम है
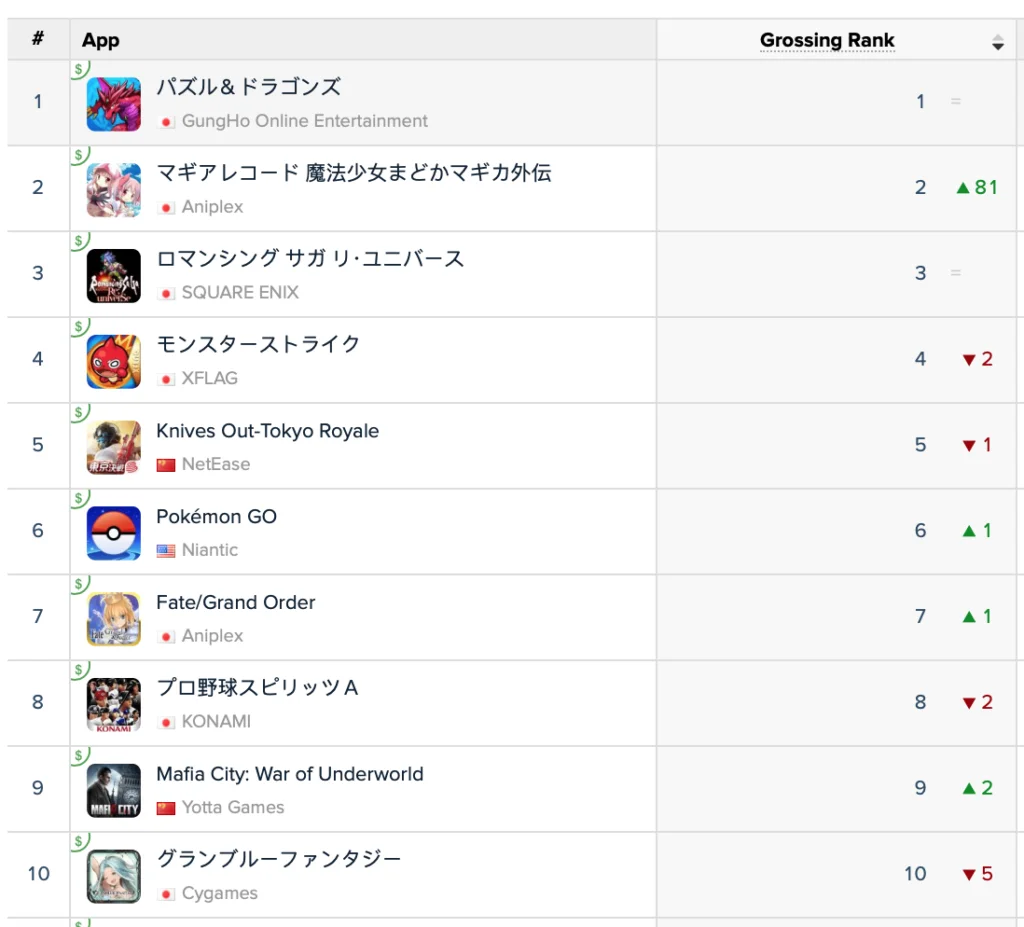
5. Japan में top grossing games (iOS और Android दोनों पर) का बड़ा हिस्सा local publishers का है
Google Play के top 10 grossing games में से 90% local companies ने बनाए हैं
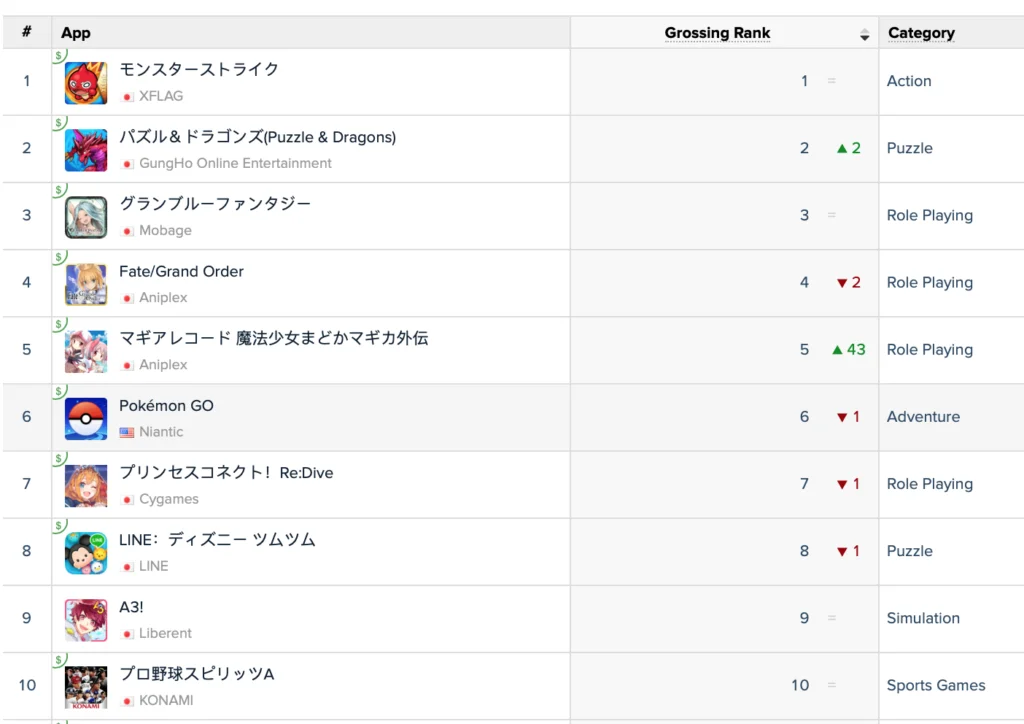
iOS के top grossing games में से 70% local companies ने बनाए हैं
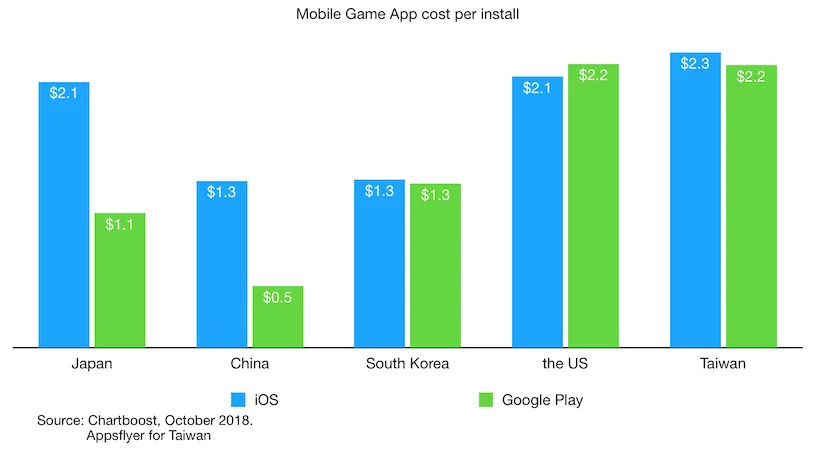
6. Japan में mobile game का cost per install China या South Korea से ज़्यादा महंगा है, लेकिन iOS और Google Play दोनों पर US या Taiwan के बराबर है
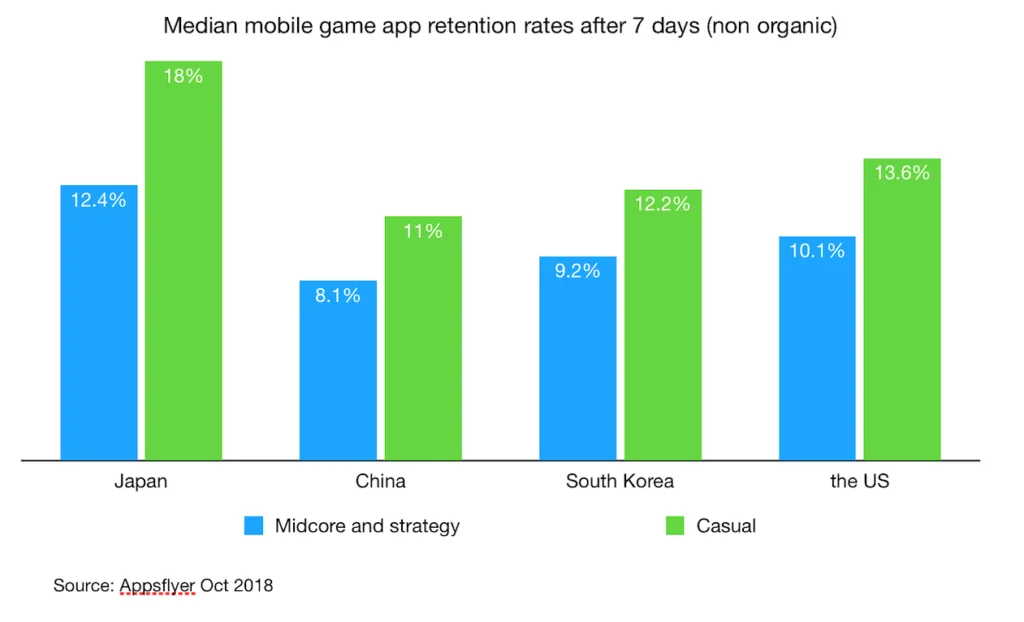
7. Acquired users के लिए Japan में 7 दिनों के बाद retention rate China, South Korea और US से बेहतर है
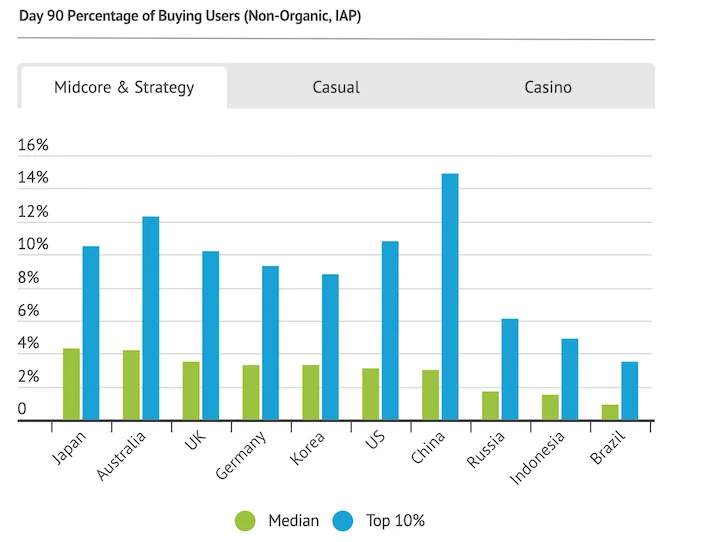
8. Japan 90 दिनों के बाद paying users के प्रतिशत में दुनिया में आगे है, लेकिन non-organic user acquisition के लिए यह प्रतिशत अभी भी बहुत कम है (AppsFlyer डेटा 2018)
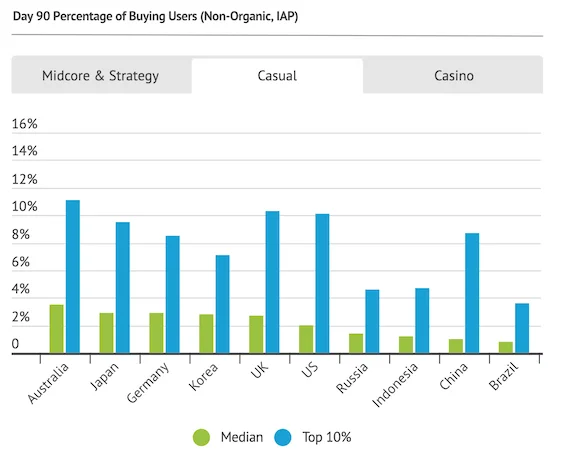
Casual games के लिए भी यही देखने को मिलता है
जैसा कि आप ऊपर देख सकते हैं, top 10% games median से 2-4 गुना बेहतर प्रदर्शन कर रहे हैं — यानी सफलता की कहानियाँ हैं, बस प्रतिस्पर्धा बहुत कड़ी है।
बस इतना ही मेरी तरफ से।
शुभकामनाओं सहित,
Chandler