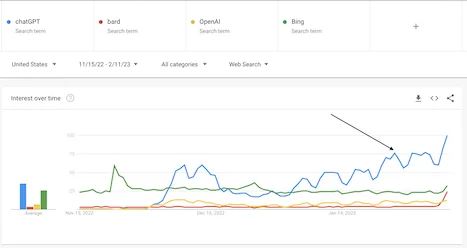
ChatGPT Code Interpreter 做 data analysis 嘅能力令我震驚
我問 ChatGPT 含糊嘅問題好似「話我知啲有趣嘅嘢」——關於國庫數據——佢即刻生成咗有洞察力嘅圖表,而我以前要花幾個鐘先整到。
呢篇文章寫於2023年,部分內容可能已經有變化。
當 Ethan Mollick 寫到 ChatGPT Code Interpreter 有幾powerful 嗰陣,我好好奇。嗰時我放緊假所以今日先有機會玩。嘩,佢真係 blow my mind!
背景講下,我決定用美國政府唔同國債嘅數據,嚟自 Treasury Direct 網站。我揀呢個 dataset 係因為我之前寫過一篇「Why You Shouldn't Believe the Hype About the TreasuryDirect Website Being Outdated」嘅 blog post,所以我對呢個 dataset 有啲熟悉。更重要嘅係,我大概記得我花咗幾耐先整到啲圖表。
Upload 成個 dataset 超簡單
撳一個button就可以 upload 成個 dataset 連 data dictionary。我唔使講太多關於個 dataset,只係由網站copy咗呢幾句。
我鍾意嘅係,唔使 prompting,ChatGPT 就自動話我知佢點理解呢個 dataset,仲俾我睇頭幾行數據做preview。
而家我可以開始同數據「傾偈」
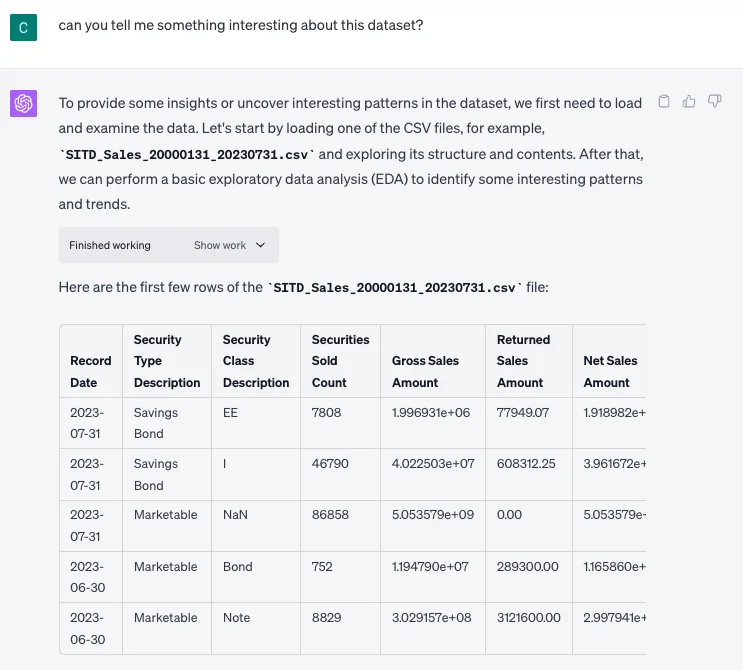
你可以話我知呢個 dataset 有咩有趣嘅嘢?
我問咗 ChatGPT 一個好含糊嘅問題「can you tell me something interesting about this dataset?」呢個係超generic嘅問題,因為我想睇 ChatGPT 可唔可以直覺地guess到人類會覺得咩有趣。
呢個係回覆:
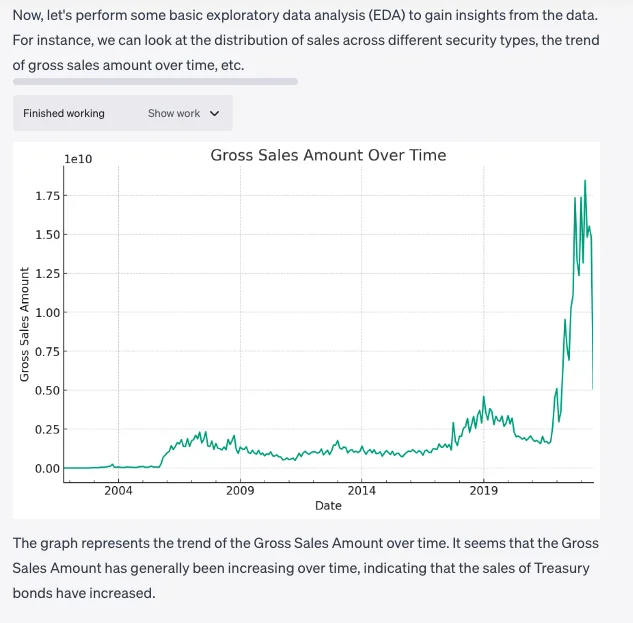
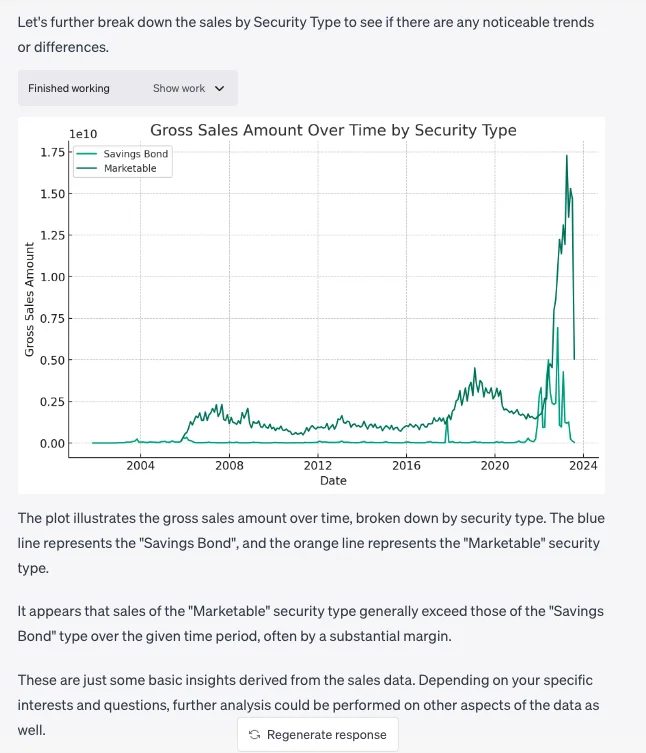
你可以見到,ChatGPT guess得啱——可能gross sales amount隨時間嘅趨勢係我最初可能會care嘅有趣嘅嘢之一。然後佢喺下一個圖表按security type breakdown gross sales。(如果你留意到用字同最終圖表之間,你會見到 ChatGPT 講錯咗顏色「orange」而唔係「darker blue」,但呢個唔係deal breaker。)
跟住我問咗 ChatGPT 另一個含糊嘅問題 :P
「Based on this dataset, do you think that the website treasury direct is getting more popular?」
我鍾意佢俾我嘅答案,因為語氣好啱。ChatGPT 清楚表明佢唔確定,呢個答案只係好多可能答案之一。
呢個係 ChatGPT 生成嘅圖表
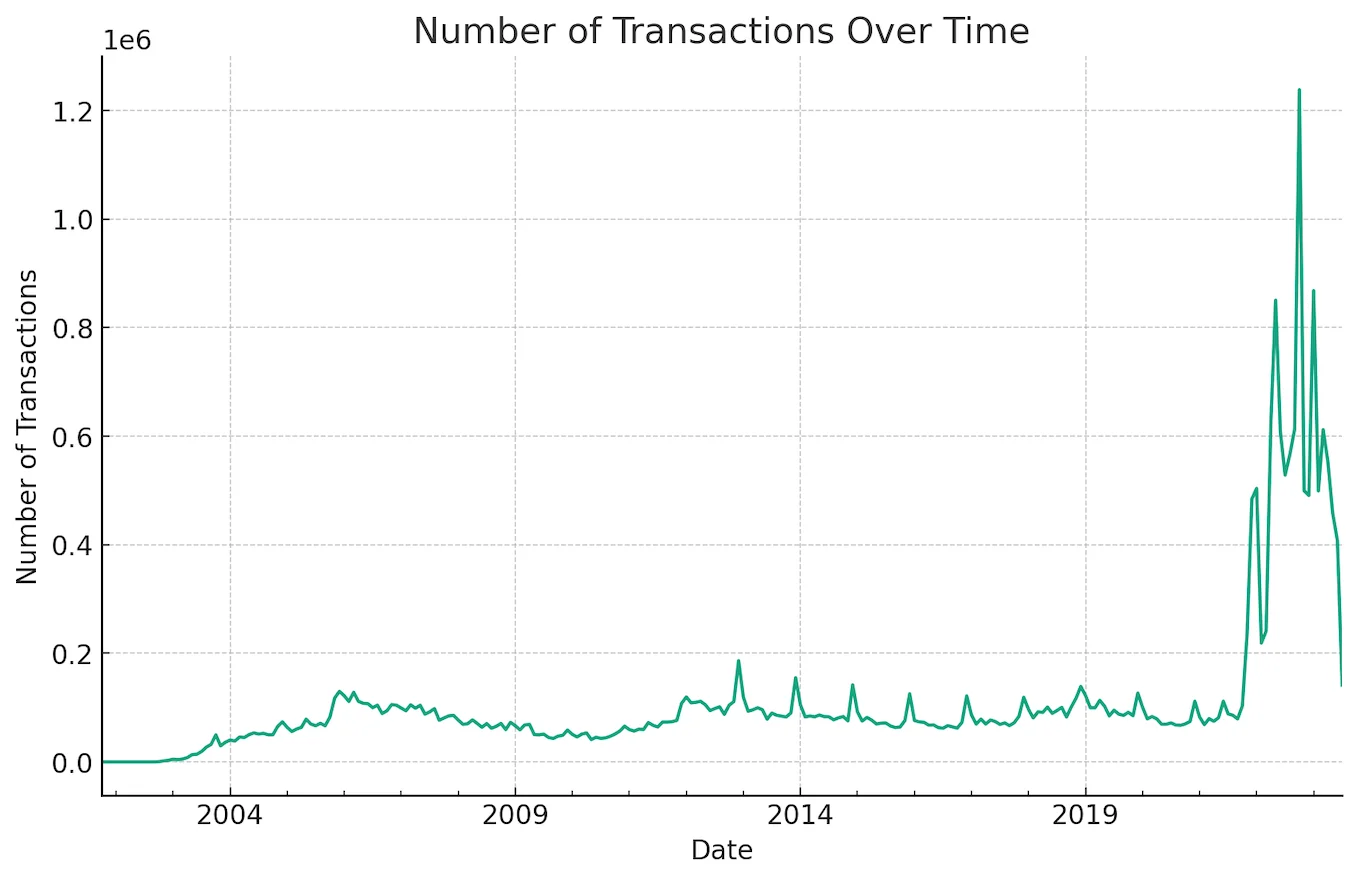
迭代係關鍵
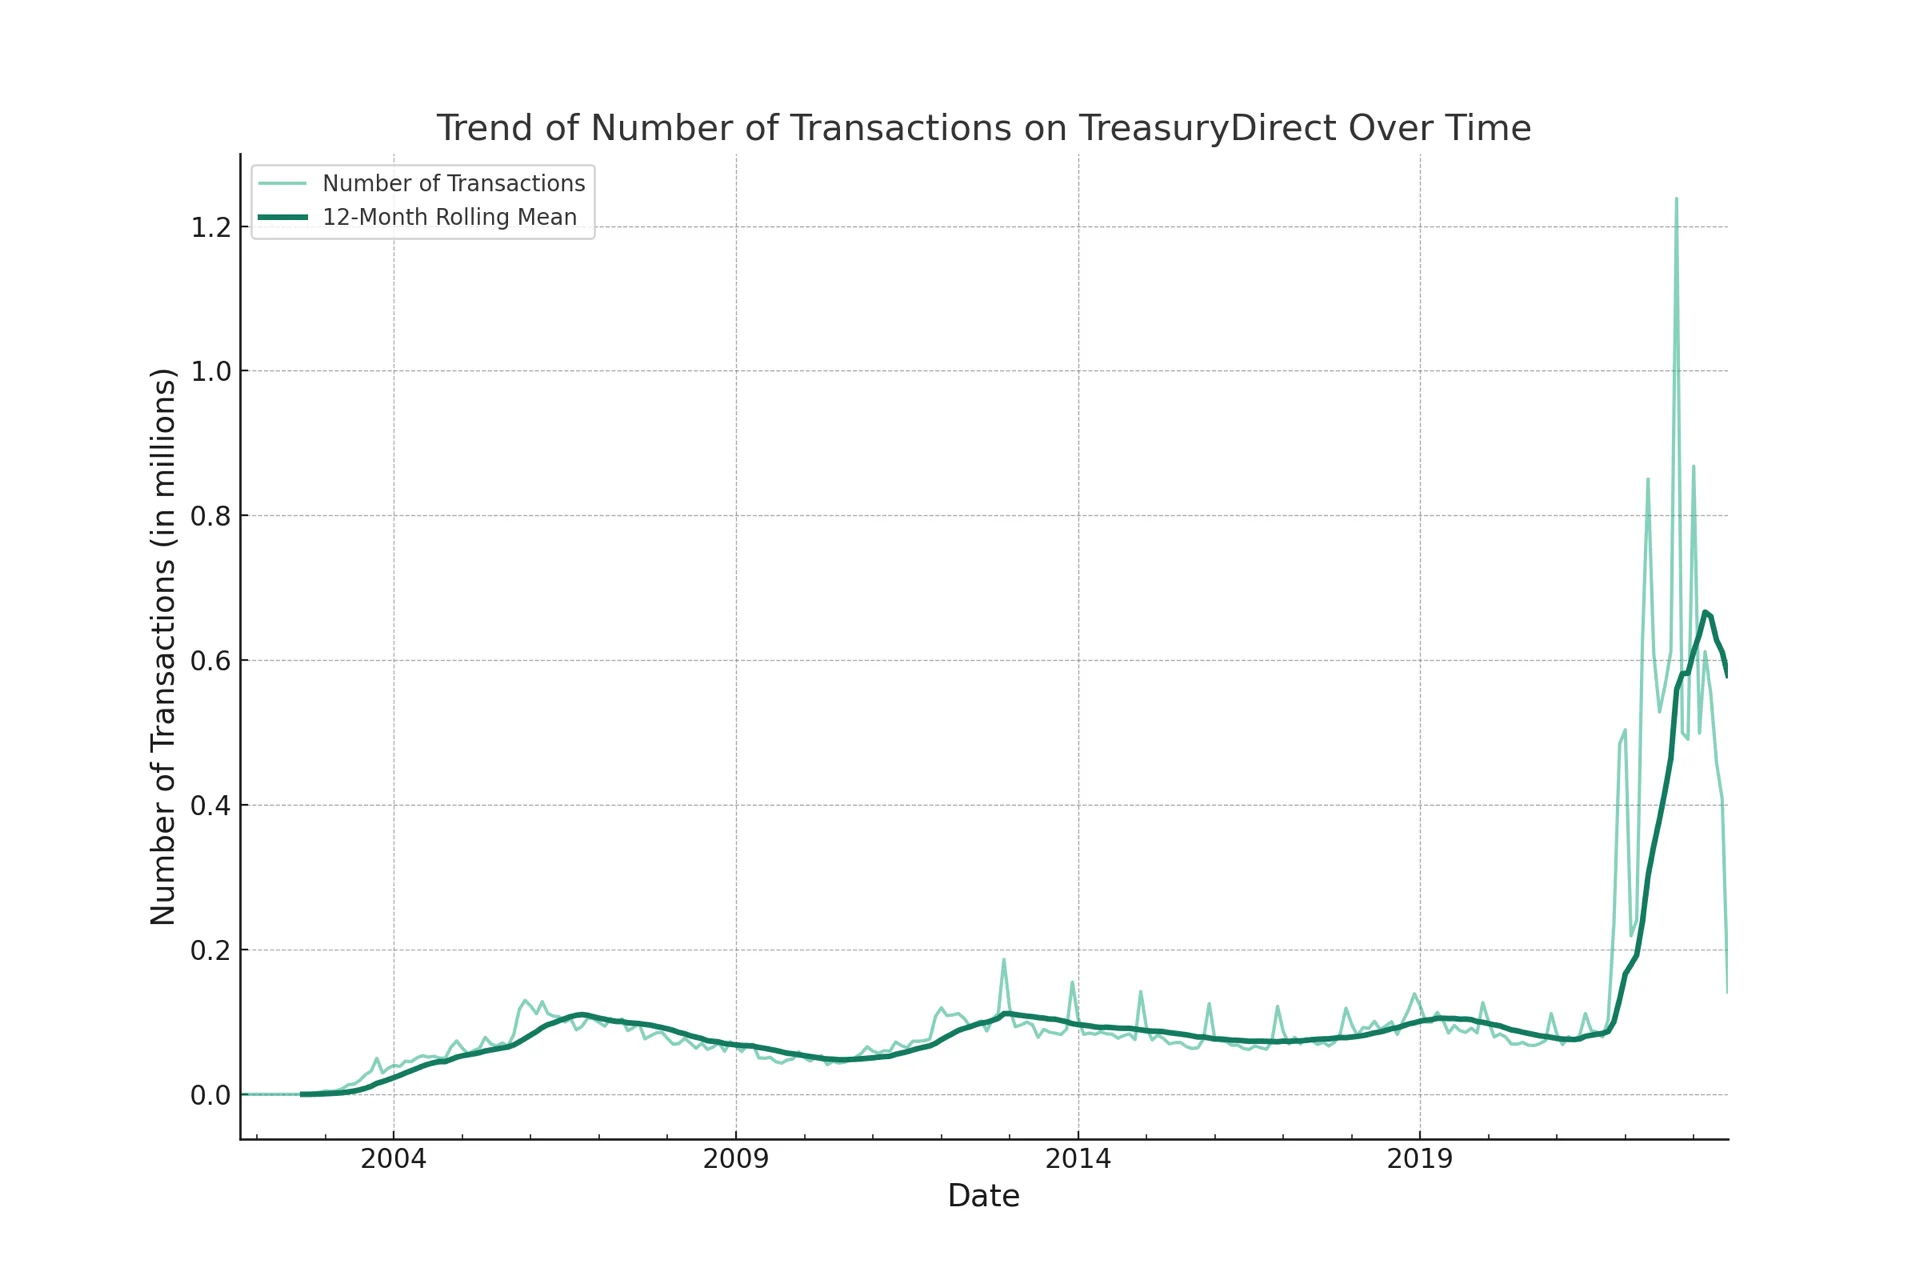
雖然以上圖表ok,但仲未係我要嘅final product。所以我問 ChatGPT「I want to include the chart about the number of transactions over time on my blog, can you reformat the chart so that it is easier to read?」
你可以見到隨時間嘅改進,一個一個嚟:
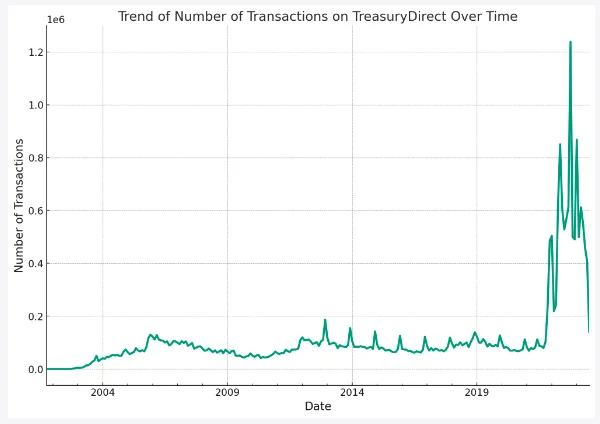
第一次改進
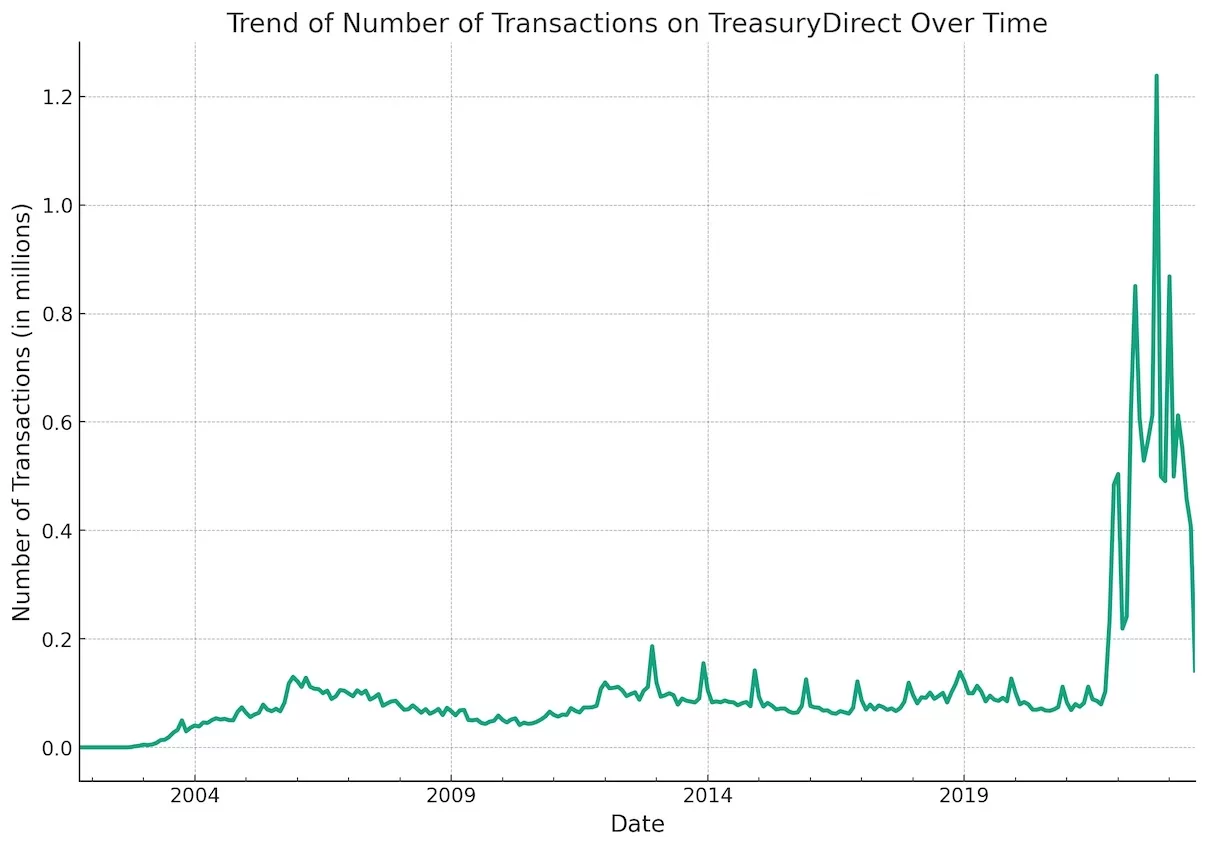
第二次改進
我留意到垂直軸有啲奇怪,所以我講「for the vertical axis, I am not sure if my audience will understand what 1e6 means?」
第三次修改
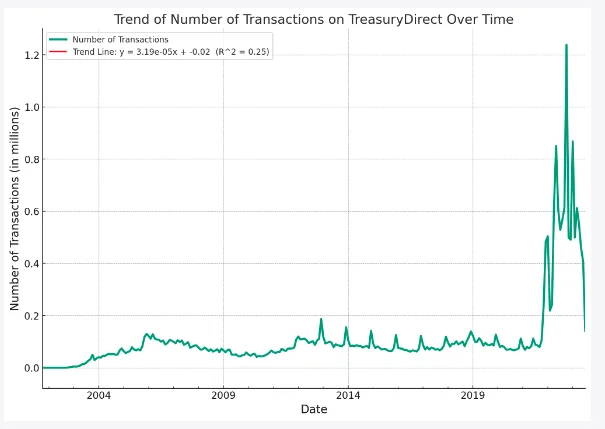
雖然 ChatGPT 嘅答案聽起嚟好confident,但你見到上面冇紅色趨勢線。所以我俾咗feedback。
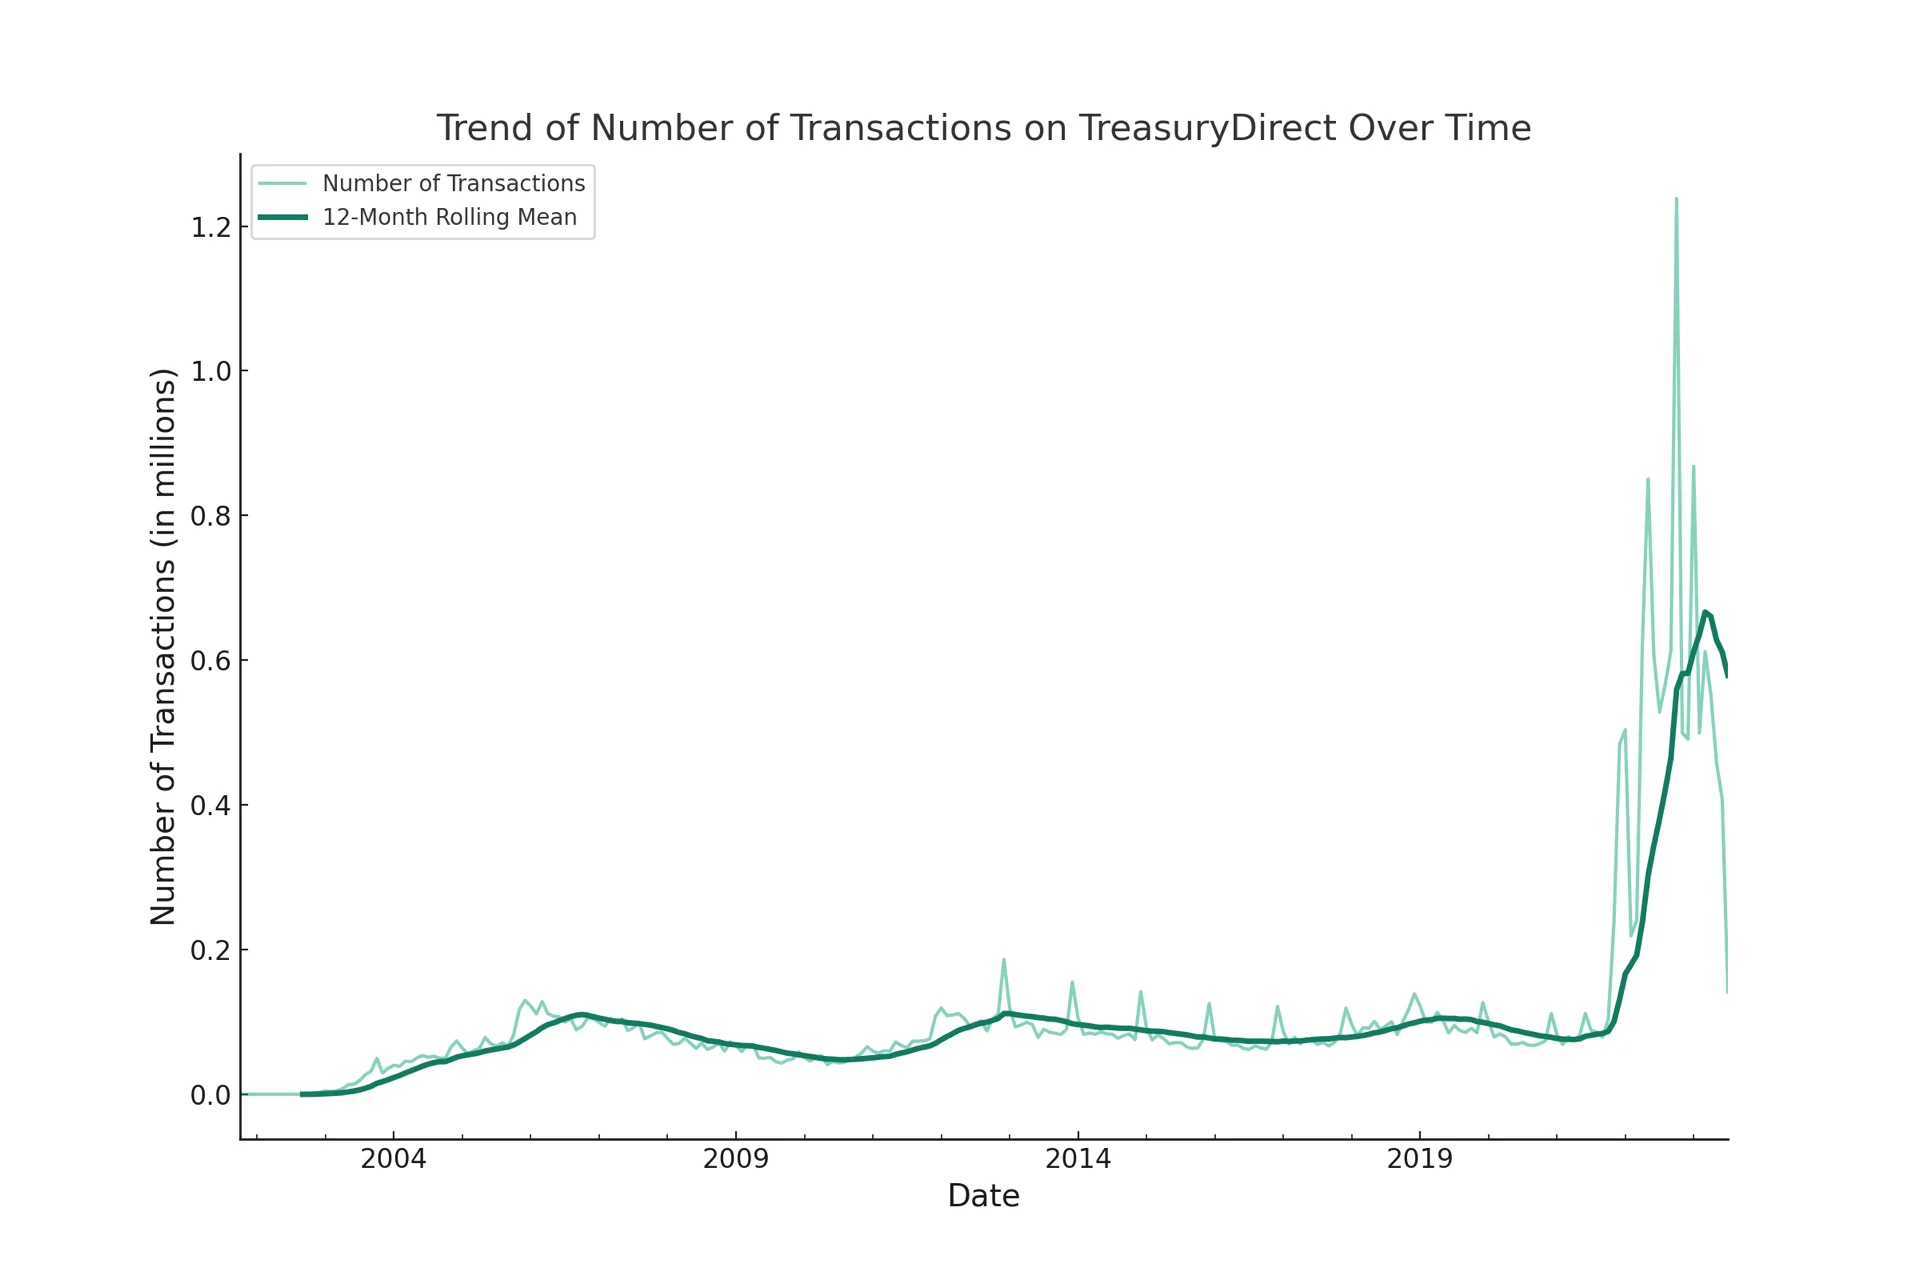
第四次修改
「I dont see the red line at all from the above chart」
ChatGPT 自動建議用12個月嘅 rolling mean(moving average),呢個好brilliant!
好正吖?我冇話過 ChatGPT 我要睇12個月嘅 rolling mean 但佢建議咗。老實講,我自己都冇諗過呢種方式嚟visualize過去幾年相對過去20年嘅巨大變化。再次super impressed!
你仲會留意到顏色嘅選擇——佢刻意用深色嚟highlight趨勢線嘅變化,呢個正正就係我想要嘅。
最終版本
讀呢個修改過程,你可能覺得花咗好長時間,但唔係,實際上每次迭代只需要5-10秒。比我自己做快好多!
直接比較我自己嘅圖表同 ChatGPT 嘅圖表
如上面提到,我用呢個 dataset 寫過 blog post,所以之前自己整過幾個圖表。而家我想比較用 ChatGPT 重新整同一個圖表會快幾多。
以下係我自己整嘅:
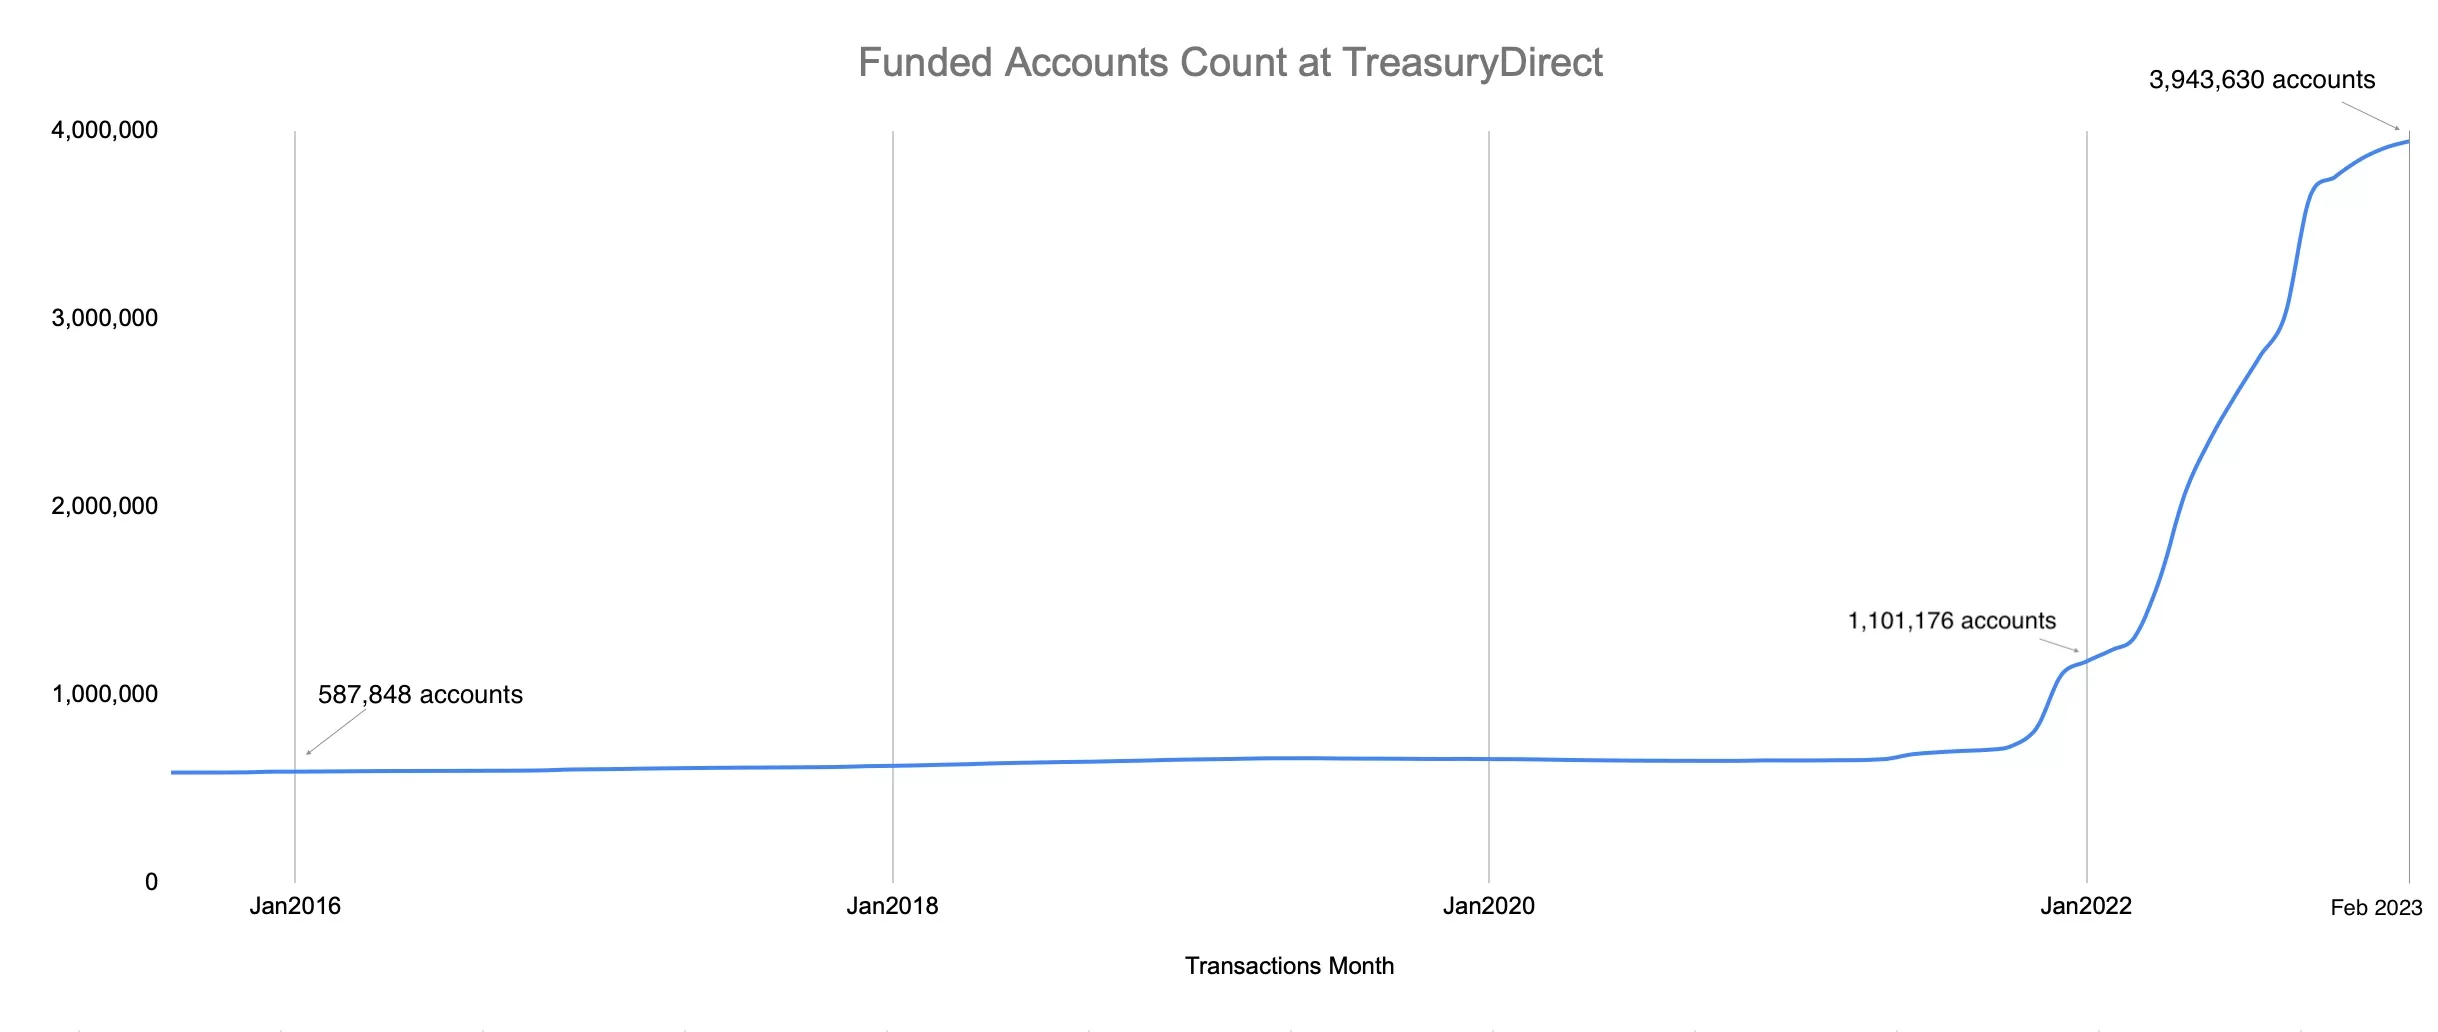
如果我冇記錯,之前整呢個圖表花咗我超過5-10分鐘。
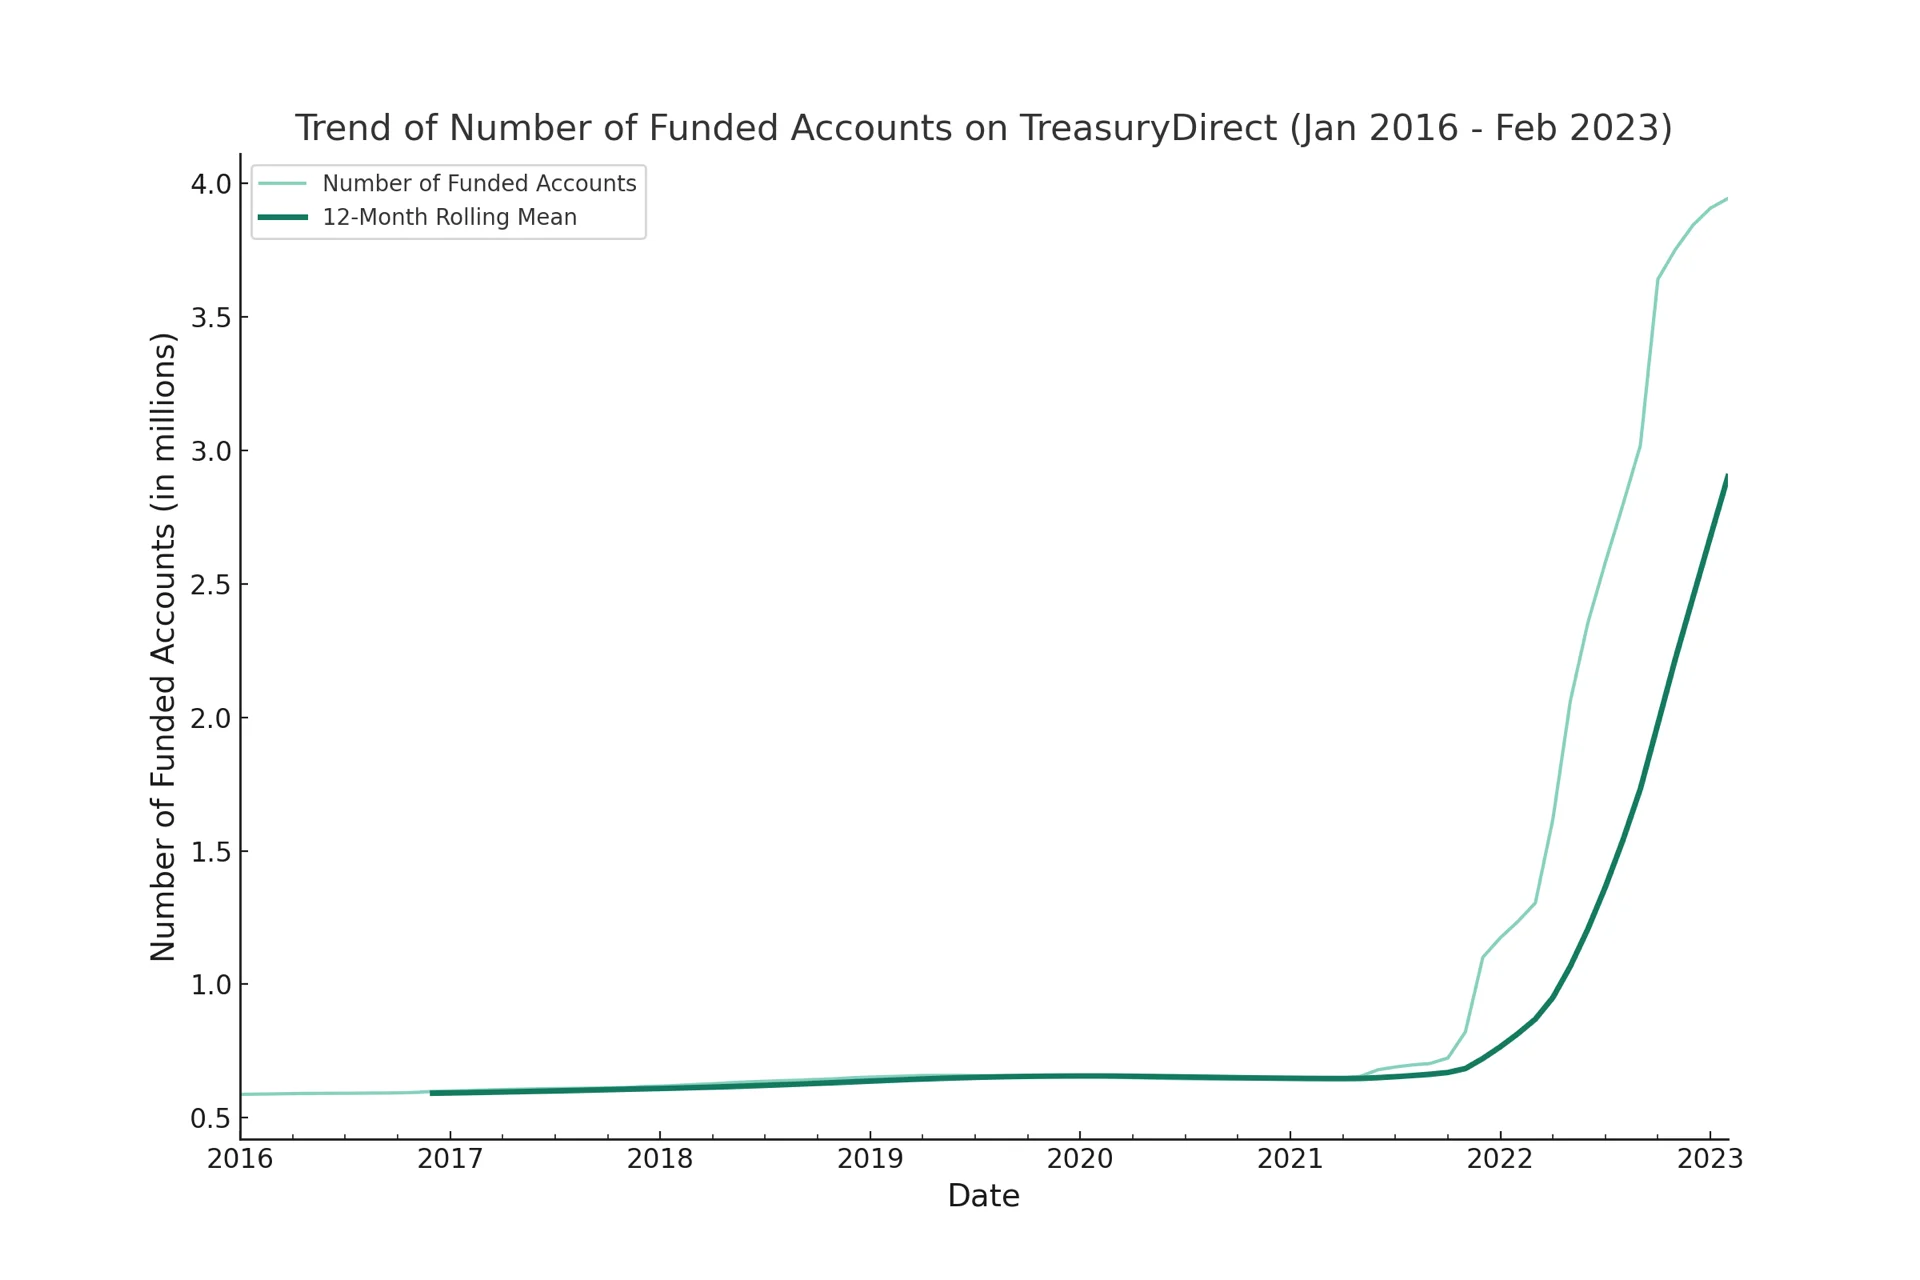
但用 ChatGPT,幾秒就搞掂,仲有bonus嘅12個月 rolling mean。你嚟judge邊個版本更好 :P
結論
ChatGPT Code Interpreter 而家做 data analysis 嘅能力令我震驚,期待將來有更多改進之後佢可以做到咩 :D
你日常最tedious嘅data task係咩?你試過攞去 Code Interpreter 未?我好奇佢handle你domain-specific嘅數據係唔係同我嘅一樣好。
祝好,
Chandler