Singapore statistics - Singapore Economy update Apr 2011
The department of Statistics of Singapore has done a fine job i would say. Recently they published "Monthly Digest of Statistics Singapore Apr 2011". The report is available online so I would assume it's free for personal use. A lot of information about Singapore was covered in this publication. It's a mater of what you need because it is a 124 page long publication. Going through the table of content you can see the followings:
- Climate and Air Quality
- Demography
- Labour and Productivity
- National Income and Balance of Payments
- Business Expectations
- Business Formation and Cessation
- Manufacturing
- Construction and Real Estate
- Services
- External Trade
- Transport and Communications
- Tourism
- Finance
- Public Finance
- Prices
- Health
- Community Services
- Culture and Recreation
- Miscellaneous
I haven't seen this level of Publicly available data for a while. It has everything, including government balance sheet, the number of Singapore citizens going to cinemas, the amount of money in circulation etc.... Many, many other countries could learn from Singapore i would say. Making decision based on guess-work or worse yet Fault data could be damaging. And here we have Singapore, a country/a city showing the whole world how transparent they can be and how data driven their culture is. Or at least, their government is. If you want to have a complete view, please download the full report here Monthly digest of statistics Singapore Mar 2011. What I will do is to include a few interesting figures.
1. 74% of Singapore residents are Chinese
In June 2010, Singapore Residents were at 3.7717 millions, in which 3.2307 millions were Singaporeans and 541,000 Permanent Residents. Singaporean Chinese are about 2.7940 millions or 74%, followed by Malays (13%), Indians (9%) and other groups. 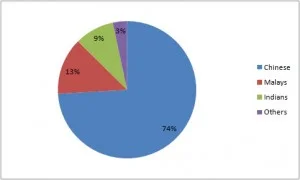 Generally there are more female residents compared to male residents (1.9106 millions females vs 1.8611 million males). Indians are the only big ethnic group in which there are more males than females (180,300 males vs 167,800 females) in Singapore. As for marriage, inter-ethnic contributed 3,550 cases in the total of 20,230 for 2010 or 17.5%. The rest was marriages of the same ethnic groups.
2. Finance services enjoy the highest monthly income in Singapore 2010
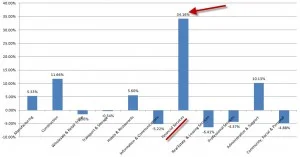
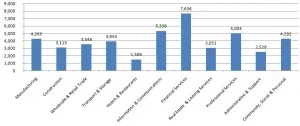 As you can see from the graph above, professionals working in financial service industry enjoy the highest average monthly income in Q4 2010, followed by information and communications. Hotels and restaurants pay the least per employee monthly during the same period last year. If we look at the year on year monthly income,
 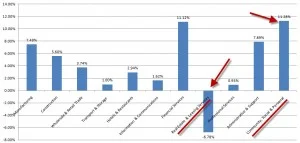 Community, social & personal saw the biggest jump in terms of percentage for monthly salary increase (11.28%). Real estate & Leasing services saw a -6.7% decrease during the same period. This is the only industry in which there was a decrease from 2009 to 2010. Looking closer at the quarter to quarter monthly income, we can see a very big spike for Financial services.
 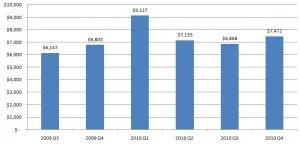 While we see an uplift from Q3 2009 to Q4 2009 and Q3 2010 vs Q4 2010, the spike in Q1 2010 could be distributed to bonuses giving out by Financial services companies. A 34% increase for financial services industry between Q4 2009 and Q1 2010 marked the highest increase in terms of percentage as compared to other industries. The graph below shows the difference between average monthly income in Q4 2009 vs Q1 2010 for various industries in Singapore.
3. Singapore attracted 11.6 million tourists in 2010
It is really a major achievement if you compare that figure with only about 5 million visitors to Vietnam in 2010, 24.6 millions visitors for Malaysia ( Singaporeans made up 13 millions or 50% of that total number) etc... Before going too deep into the numbers, let's just hold one moment and see if Tourism boards of SouthEast Asia countries have websites to promote their respective countries:
- Singapore tourism board: Your Singapore
- Malaysia tourism board: Tourism Malaysia
- Thailand tourism board: Tourism Thailand
- Indonesia Ministry of culture and Tourism: Visit Indonesia
- The Philippines: Department of Tourism
- Vietnam: Vietnam Tourism official site
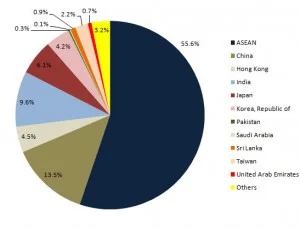
Just look at these websites, you probably can make your own conclusion on how great tourism in a country would be. Coming back to Singapore, nearly 75% of all tourists to Singapore in 2010 were from Asia. 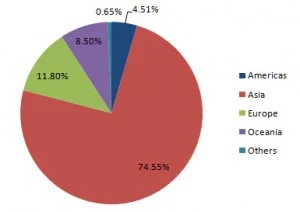 Looking further into Asia, Asean contributed 55.6% of all tourists.
  The above graphs and figures only cover Singapore tourist numbers, Singapore statistics department even went further and looked at the total number of total number of air passenger arrivals by country of embarkation. That number was a whopping 20.5 millions air passenger arrivals in Singapore in 2010. This number i assume include passengers coming to Singapore to work and other purposes.
 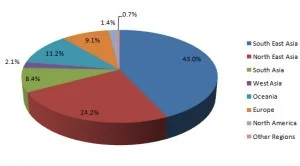 SouthEast Asia was still the main source with 43%. Air passenger departures by country of disembarkation amounted to 20.437264 million in 2010 vs arrivals of 20.486452 millions in 2010. So about 49,188 people (20,486,452 minus 20,473,264) stayed in Singapore after arriving at the airport in 2010. Singapore population increased by 89,100 in 2010. Singapore residents increased by 37,800 and non residents increased by 51,300.
4. 20,321,100 attendances at cinemas in Singapore in 2010
If we divide the total attendances to total population, people who stay in Singapore go to the cinema on average 4 times per year. We only recorded 7,163,669 attendances at swimming pools in Singapore in 2010 and 1,823,321 attendances at gymnasium. In terms of bookings, badminton courts were booked 401,390 times in 2010 (refer to sports facilities provided by SSC), followed by Tennis 115,900 times, table-tennis 61,081 times. Overall however, Singapore residents seem to go to the swimming pool, gymnasium or other sports less in 2010 compared to 2009. Jogging is impossible to count so we don't have anything to say there. As mentioned earlier, there are lots of information available in the original report and it's not my intention to restate everything here. It's recommended that you download the report and have a read yourself. Feel free to drop any questions you may have. Have a nice weekend everyone, Chandler